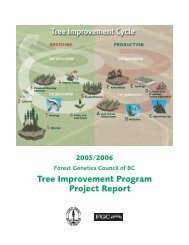
Tree Improvement Program Project Report 2006 / 2007
Tree Improvement Program Project Report 2006 / 2007
Tree Improvement Program Project Report 2006 / 2007

You also want an ePaper? Increase the reach of your titles
YUMPU automatically turns print PDFs into web optimized ePapers that Google loves.
T R E E I M P R O V E M E N T P R O G R A M<br />
Table 1: Percent seedling damage after the first winter by damage class and female<br />
x male parent source.<br />
Number of Seedlings and % Damage by Class and Parent Source<br />
Damage Number of Female/Male Parent Source<br />
WANSA Class Seedlings KAL/KAL KAL/PG PG/KAL PG/PG<br />
none 8400 29.1 24.3 25.8 20.9<br />
50% 180 36.1 24.4 16.7 22.8<br />
dead 232 30.6 19.4 28.9 21.1<br />
PGTIS KAL/KAL KAL/PG PG/KAL PG/PG<br />
none 1086 29.1 24.5 25.2 21.2<br />
50% 2803 31.0 24.2 22.9 22.0<br />
dead 43 25.6 20.9 34.8 18.6<br />
.2.13 Development of Pollen Qual ty<br />
Gu del nes for Poll nat ons n<br />
Western Redcedar<br />
Seed Orchards. (SPU 0213)<br />
Oldr ch Hak<br />
The objective of this project is to develop pollen quality<br />
guidelines based on the relationship between pollen quality<br />
(viability) and the percentage of filled seed produced.<br />
Pollen collection, processing, and storage are required<br />
for control and supplemental mass pollinations in western<br />
redcedar seed orchards. Because of its small size and limited<br />
food reserves, western redcedar pollen is exceptionally<br />
susceptible to damage from premature pollen collection,<br />
adverse temperature, and humidity conditions during<br />
processing, and adverse storage conditions. As a result, there<br />
is a wide range in pollen quality among various collections<br />
used for pollination.<br />
Establishing a relationship between pollen viability<br />
and the percentage of viable seed produced will resolve the<br />
question of the levels of pollen quality (i.e., % of pollen<br />
viability) at which unacceptable numbers of filled seed is<br />
produced (i.e., when the percentage of filled seed is zero or<br />
very low).<br />
The study was established at the Cowichan Lake<br />
Research Station and at the Mount Newton Seed Orchard<br />
P R O J E C T R E P O R T 2 0 0 6 / 2 0 0 7<br />
Table 22. Percent seedl ng damage after<br />
the first w nter by damage class and<br />
female x male parent source.<br />
in Saanichton (Timber West). Stored and freshly collected<br />
pollen will be tested for viability using solid media<br />
germination technique.<br />
In the first year, approximately 50 pollen lots with<br />
various levels of viability, ranging from 0% to 90%, will be<br />
used to control pollinate female flowers. Each pollen lot will<br />
be tested on two different clones with two control crosses<br />
per clone to a total of 200 control crosses. Approximately<br />
40 trees (clones) will be needed for the control pollinations<br />
because several different crosses can be done on each<br />
tree. Male cones will be picked away from females on<br />
selected branches, and each branch will be isolated with a<br />
pollination bag. Each tree will be monitored frequently for<br />
female receptivity (i.e., pollination drops). There will be<br />
two pollinations per cross. Pollination bags will be replaced<br />
later with insect bags.<br />
Cones will be monitored for development and collected<br />
in the fall. Collected cones will be dried, and seed will<br />
be extracted and cleaned. Three samples of 100 seed per<br />
sample will be taken from each cross, and cutting and<br />
examining each seed will determine the number of filled<br />
and empty seed. The percentage of filled seed per cross will<br />
be calculated.<br />
Collected data will be used to show in graph form the<br />
relationship between percent of pollen germination and<br />
percent of filled seed.