Tree Improvement Program Project Report 2006 / 2007
Tree Improvement Program Project Report 2006 / 2007
Tree Improvement Program Project Report 2006 / 2007

You also want an ePaper? Increase the reach of your titles
YUMPU automatically turns print PDFs into web optimized ePapers that Google loves.
.2.1 Conduct ng a Ser es of So l<br />
Tests n the Kalamalka Larch<br />
Seed Orchards to obta n a<br />
Basel ne Ind cat on of the Levels<br />
of Pythium and Fusarium<br />
(SPU 1303)<br />
Gary G ampa<br />
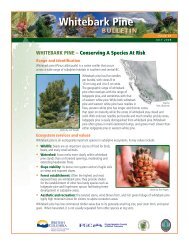
Object ves<br />
In 2005 Kalamalka lost almost five percent of the ramets<br />
in our larch seed orchards. The trees were either very<br />
productive mature ramets or new transplants with a high<br />
breeding value. An investigation by Michael Peterson<br />
of Applied Forest Sciences indicated the possibility that<br />
pathogen levels in the soil were high enough to cause<br />
a disease threat. If we can determine levels of Pythium<br />
and Fusarium present in the orchards, our management<br />
techniques can be modified to maximise ramet survival and<br />
maintain seed production levels.<br />
Act v t es<br />
In order to obtain a baseline indication of the levels of<br />
Pythium and Fusarium, we made a series of soil tests in<br />
transects across the seed orchards. The samples were then<br />
analysed for pathogens. The samples were collected in the<br />
spring, summer, and fall of <strong>2006</strong>.<br />
Results<br />
These tests indicated that levels of soil-borne Pythium and<br />
Fusarium fungi in both Kalamalka larch seed orchards were<br />
significantly higher than levels that are commonly believed<br />
to lead to disease conditions.<br />
spring summer fall<br />
Pythium<br />
propagules<br />
per gram<br />
average 1834 5545 2271<br />
Fusarium<br />
propagules<br />
per gram<br />
average 3458 9033 3047<br />
Table 23.<br />
T R E E I M P R O V E M E N T P R O G R A M<br />
P R O J E C T R E P O R T 2 0 0 6 / 2 0 0 7<br />
Output and del verables<br />
It is impossible to state conclusively that these high<br />
pathogen levels are causing the mortality in the Kalamalka<br />
larch orchards, but the levels are a concern. In <strong>2007</strong> we<br />
intend to test several different irrigation regimes in our<br />
larch orchards in an effort to reduce these high levels of<br />
harmful pathogens. We will collect and analyse soil samples<br />
to determine the response of the Pythium and Fusarium<br />
fungi to various watering treatments.<br />
.2.1 Collect on of Crop Stat st cs<br />
for Inter or Lodgepole P ne<br />
Orchards<br />
Prepared for M chael Carlson by Joe Webber,<br />
ProSeed Consult ng<br />
The Lodgepole Pine Task Force met on January 25, <strong>2006</strong><br />
(VSOC) and determined the need to develop methodology<br />
for making comparisons among producing lodgepole<br />
pine seed orchards. The underlying concern is that seed<br />
production from north Okanagan orchards is significantly<br />
less than expected. To determine the source of these losses<br />
and make recommendations for orchard management<br />
practices to improve seed production, the task force<br />
required standardized collection of data for all producing<br />
orchards. This project developed standard methods for<br />
estimating the number of cones per tree based on cone<br />
weight, and for estimating cone yields (filled seed per cone,<br />
total seed per cone, seed weight), pollen cloud density,<br />
and seed losses from insect predation. As these data are<br />
collected over several years, trends in yearly variation in<br />
cone numbers and seed yields will help determine why seed<br />
set in the north Okanagan lodgepole pine seed orchards is<br />
chronically low. A summary of the methodology and results<br />
for OTIP project 0722 follows. A detailed final report for<br />
SPU 0722 (<strong>2006</strong>) is available from the OTIP coordinator.<br />
In the spring of <strong>2006</strong>, 15 trees (clones) were selected<br />
to include both early, mid- and late-flowering clones. The<br />
number of cones per tree was estimated by weighing a<br />
known number of cones and the total number of cones<br />
per tree. This method removed a source of error that<br />
resulted from estimating cone numbers per tree by volume.<br />
Figure 59 shows the data for the 15 selected trees (+/-<br />
9