

THE FIAT GROUP IN
THE FIAT GROUP IN
THE FIAT GROUP IN

Create successful ePaper yourself
Turn your PDF publications into a flip-book with our unique Google optimized e-Paper software.
In Western Europe, Fiat Auto sold 1,456,000 automobiles<br />
and light commercial vehicles, down 13.7% from 2000.<br />
This decrease was partially attributable to the cutbacks in<br />
dealer network car inventory and the natural contraction in<br />
volumes due to phase-out of Bravo and Brava models in<br />
anticipation of the gradual introduction of the Stilo during<br />
the last quarter of the year.<br />
The ongoing crisis on local markets caused sharp sales<br />
decreases in Poland (-42.9%) and Argentina (-61%). On the<br />
other hand, Fiat Auto sales improved significantly in Brazil<br />
(+14.9%).<br />
❚ CNH Global revenues in 2001 totaled 10,777 million euros,<br />
in line with previous year results. Expressed in dollars,<br />
the functional currency of this sector, CNH revenues were<br />
down by approximately 3%, stemming largely from lower<br />
sales revenues due to divestment of production units in<br />
compliance with requests made by antitrust authorities<br />
in North America and Europe following acquisition of the<br />
Case Group. Furthermore, the Sector faced a particularly<br />
unfavorable market in the construction equipment segment<br />
due to a steep decline in demand in Western Europe and<br />
North America.<br />
At the segment level, Sector revenues from agricultural<br />
equipment improved (+3%), mainly in North America and<br />
Brazil, while remaining weak in Europe. On the other hand,<br />
construction equipment revenues significantly decreased<br />
(-15%) due to the previously mentioned contraction in<br />
demand.<br />
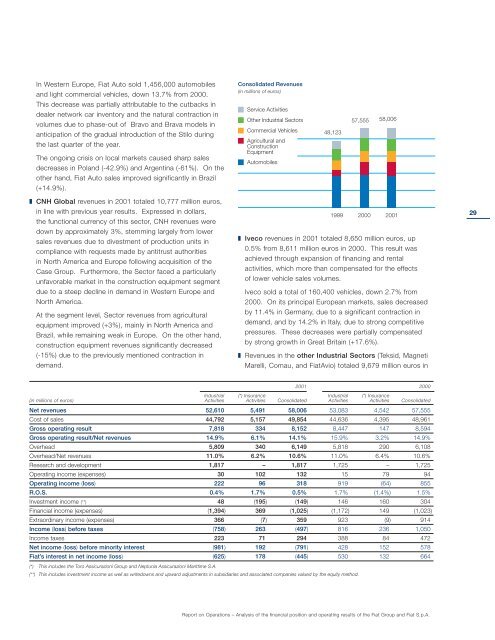
Consolidated Revenues<br />
(in millions of euros)<br />
Service Activities<br />
Other Industrial Sectors<br />
Commercial Vehicles<br />
Agricultural and<br />
Construction<br />
Equipment<br />
Automobiles<br />
48,123<br />
1999<br />
57,555<br />
2000<br />
58,006<br />
2001<br />
❚ Iveco revenues in 2001 totaled 8,650 million euros, up<br />
0.5% from 8,611 million euros in 2000. This result was<br />
achieved through expansion of financing and rental<br />
activities, which more than compensated for the effects<br />
of lower vehicle sales volumes.<br />
Iveco sold a total of 160,400 vehicles, down 2.7% from<br />
2000. On its principal European markets, sales decreased<br />
by 11.4% in Germany, due to a significant contraction in<br />
demand, and by 14.2% in Italy, due to strong competitive<br />
pressures. These decreases were partially compensated<br />
by strong growth in Great Britain (+17.6%).<br />
❚ Revenues in the other Industrial Sectors (Teksid, Magneti<br />
Marelli, Comau, and FiatAvio) totaled 9,679 million euros in<br />
2001 2000<br />
(in millions of euros)<br />
Industrial<br />
Activities<br />
(*) Insurance<br />
Activities Consolidated<br />
Industrial<br />
Activities<br />
(*) Insurance<br />
Activities Consolidated<br />
Net revenues 52,610 5,491 58,006 53,083 4,542 57,555<br />
Cost of sales 44,792 5,157 49,854 44,636 4,395 48,961<br />
Gross operating result 7,818 334 8,152 8,447 147 8,594<br />
Gross operating result/Net revenues 14.9% 6.1% 14.1% 15.9% 3.2% 14.9%<br />
Overhead 5,809 340 6,149 5,818 290 6,108<br />
Overhead/Net revenues 11.0% 6.2% 10.6% 11.0% 6.4% 10.6%<br />
Research and development 1,817 – 1,817 1,725 – 1,725<br />
Operating income (expenses) 30 102 132 15 79 94<br />
Operating income (loss) 222 96 318 919 (64) 855<br />
R.O.S. 0.4% 1.7% 0.5% 1.7% (1.4%) 1.5%<br />
Investment income (**) 48 (195) (149) 146 160 304<br />
Financial income (expenses) (1,394) 369 (1,025) (1,172) 149 (1,023)<br />
Extraordinary income (expenses) 366 (7) 359 923 (9) 914<br />
Income (loss) before taxes (758) 263 (497) 816 236 1,050<br />
Income taxes 223 71 294 388 84 472<br />
Net income (loss) before minority interest (981) 192 (791) 428 152 578<br />
Fiat’s interest in net income (loss) (625) 178 (445) 530 132 664<br />
(*) This includes the Toro Assicurazioni Group and Neptunia Assicurazioni Marittime S.A.<br />
(**) This includes investment income as well as writedowns and upward adjustments in subsidiaries and associated companies valued by the equity method.<br />
Report on Operations – Analysis of the financial position and operating results of the Fiat Group and Fiat S.p.A.<br />
29<br />
29


