Crop production data and forecasts system in ... - Foodnet - cgiar
Crop production data and forecasts system in ... - Foodnet - cgiar
Crop production data and forecasts system in ... - Foodnet - cgiar

Create successful ePaper yourself
Turn your PDF publications into a flip-book with our unique Google optimized e-Paper software.
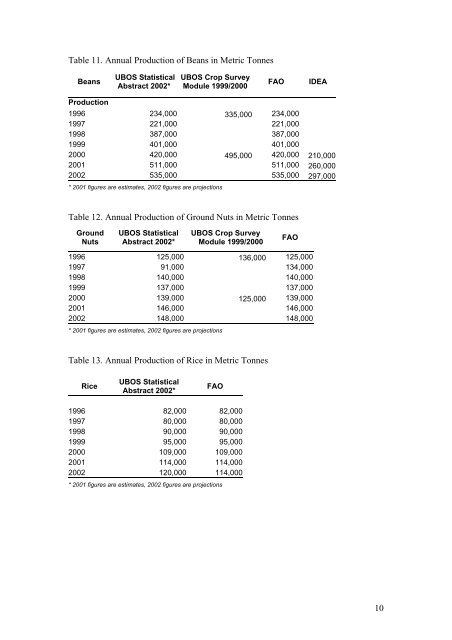
Table 11. Annual Production of Beans <strong>in</strong> Metric Tonnes<br />
Beans<br />
Production<br />
UBOS Statistical<br />
Abstract 2002*<br />
UBOS <strong>Crop</strong> Survey<br />
Module 1999/2000<br />
FAO IDEA<br />
1996 234,000 335,000 234,000<br />
1997 221,000 221,000<br />
1998 387,000 387,000<br />
1999 401,000 401,000<br />
2000 420,000 495,000 420,000 210,000<br />
2001 511,000 511,000 260,000<br />
2002 535,000 535,000 297,000<br />
* 2001 figures are estimates, 2002 figures are projections<br />
Table 12. Annual Production of Ground Nuts <strong>in</strong> Metric Tonnes<br />
Ground<br />
Nuts<br />
UBOS Statistical<br />
Abstract 2002*<br />
UBOS <strong>Crop</strong> Survey<br />
Module 1999/2000<br />
FAO<br />
1996 125,000 136,000 125,000<br />
1997 91,000 134,000<br />
1998 140,000 140,000<br />
1999 137,000 137,000<br />
2000 139,000 125,000 139,000<br />
2001 146,000 146,000<br />
2002 148,000 148,000<br />
* 2001 figures are estimates, 2002 figures are projections<br />
Table 13. Annual Production of Rice <strong>in</strong> Metric Tonnes<br />
Rice<br />
UBOS Statistical<br />
Abstract 2002*<br />
FAO<br />
1996 82,000 82,000<br />
1997 80,000 80,000<br />
1998 90,000 90,000<br />
1999 95,000 95,000<br />
2000 109,000 109,000<br />
2001 114,000 114,000<br />
2002 120,000 114,000<br />
* 2001 figures are estimates, 2002 figures are projections<br />
10