Crop production data and forecasts system in ... - Foodnet - cgiar
Crop production data and forecasts system in ... - Foodnet - cgiar
Crop production data and forecasts system in ... - Foodnet - cgiar

You also want an ePaper? Increase the reach of your titles
YUMPU automatically turns print PDFs into web optimized ePapers that Google loves.
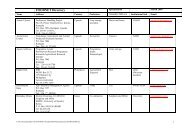
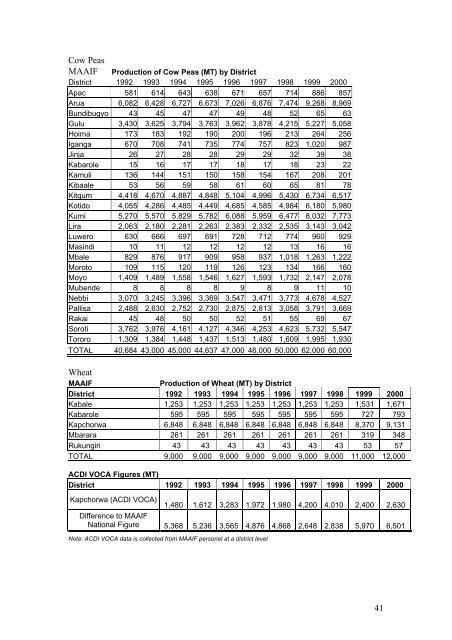
Cow Peas<br />
MAAIF Production of Cow Peas (MT) by District<br />
District 1992 1993 1994 1995 1996 1997 1998 1999 2000<br />
Apac 581 614 643 638 671 657 714 886 857<br />
Arua 6,082 6,428 6,727 6,673 7,026 6,876 7,474 9,268 8,969<br />
Bundibugyo 43 45 47 47 49 48 52 65 63<br />
Gulu 3,430 3,625 3,794 3,763 3,962 3,878 4,215 5,227 5,058<br />
Hoima 173 183 192 190 200 196 213 264 256<br />
Iganga 670 708 741 735 774 757 823 1,020 987<br />
J<strong>in</strong>ja 26 27 28 28 29 29 32 39 38<br />
Kabarole 15 16 17 17 18 17 18 23 22<br />
Kamuli 136 144 151 150 158 154 167 208 201<br />
Kibaale 53 56 59 58 61 60 65 81 78<br />
Kitgum 4,418 4,670 4,887 4,848 5,104 4,996 5,430 6,734 6,517<br />
Kotido 4,055 4,286 4,485 4,449 4,685 4,585 4,984 6,180 5,980<br />
Kumi 5,270 5,570 5,829 5,782 6,088 5,959 6,477 8,032 7,773<br />
Lira 2,063 2,180 2,281 2,263 2,383 2,332 2,535 3,143 3,042<br />
Luwero 630 666 697 691 728 712 774 960 929<br />
Mas<strong>in</strong>di 10 11 12 12 12 12 13 16 16<br />
Mbale 829 876 917 909 958 937 1,018 1,263 1,222<br />
Moroto 109 115 120 119 126 123 134 166 160<br />
Moyo 1,409 1,489 1,558 1,546 1,627 1,593 1,732 2,147 2,078<br />
Mubende 8 8 8 8 9 8 9 11 10<br />
Nebbi 3,070 3,245 3,396 3,369 3,547 3,471 3,773 4,678 4,527<br />
Pallisa 2,488 2,630 2,752 2,730 2,875 2,813 3,058 3,791 3,669<br />
Rakai 45 48 50 50 52 51 55 69 67<br />
Soroti 3,762 3,976 4,161 4,127 4,346 4,253 4,623 5,732 5,547<br />
Tororo 1,309 1,384 1,448 1,437 1,513 1,480 1,609 1,995 1,930<br />
TOTAL 40,684 43,000 45,000 44,637 47,000 46,000 50,000 62,000 60,000<br />
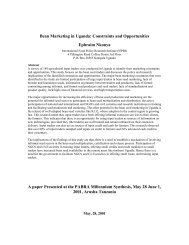
Wheat<br />
MAAIF Production of Wheat (MT) by District<br />
District 1992 1993 1994 1995 1996 1997 1998 1999 2000<br />
Kabale 1,253 1,253 1,253 1,253 1,253 1,253 1,253 1,531 1,671<br />
Kabarole 595 595 595 595 595 595 595 727 793<br />
Kapchorwa 6,848 6,848 6,848 6,848 6,848 6,848 6,848 8,370 9,131<br />
Mbarara 261 261 261 261 261 261 261 319 348<br />
Rukungiri 43 43 43 43 43 43 43 53 57<br />
TOTAL 9,000 9,000 9,000 9,000 9,000 9,000 9,000 11,000 12,000<br />
ACDI VOCA Figures (MT)<br />
District 1992 1993 1994 1995 1996 1997 1998 1999 2000<br />
Kapchorwa (ACDI VOCA)<br />
1,480 1,612 3,283 1,972 1,980 4,200 4,010 2,400 2,630<br />
Difference to MAAIF<br />
National Figure 5,368 5,236 3,565 4,876 4,868 2,648 2,838 5,970 6,501<br />
Note: ACDI VOCA <strong>data</strong> is collected from MAAIF personel at a district level<br />
41