Crop production data and forecasts system in ... - Foodnet - cgiar
Crop production data and forecasts system in ... - Foodnet - cgiar
Crop production data and forecasts system in ... - Foodnet - cgiar

You also want an ePaper? Increase the reach of your titles
YUMPU automatically turns print PDFs into web optimized ePapers that Google loves.
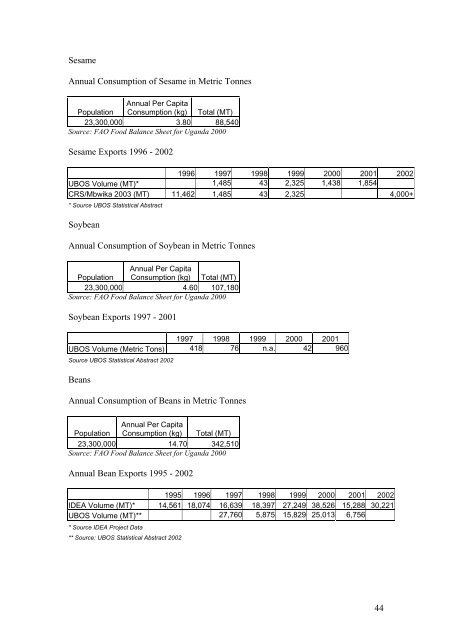
Sesame<br />
Annual Consumption of Sesame <strong>in</strong> Metric Tonnes<br />
Population<br />
Annual Per Capita<br />
Consumption (kg) Total (MT)<br />
23,300,000 3.80 88,540<br />
Source: FAO Food Balance Sheet for Ug<strong>and</strong>a 2000<br />
Sesame Exports 1996 - 2002<br />
1996 1997 1998 1999 2000 2001 2002<br />
UBOS Volume (MT)* 1,485 43 2,325 1,438 1,854<br />
CRS/Mbwika 2003 (MT) 11,462 1,485 43 2,325 4,000+<br />
* Source UBOS Statistical Abstract<br />
Soybean<br />
Annual Consumption of Soybean <strong>in</strong> Metric Tonnes<br />
Population<br />
Annual Per Capita<br />
Consumption (kg) Total (MT)<br />
23,300,000 4.60 107,180<br />
Source: FAO Food Balance Sheet for Ug<strong>and</strong>a 2000<br />
Soybean Exports 1997 - 2001<br />
1997 1998 1999 2000 2001<br />
UBOS Volume (Metric Tons) 418 76 n.a. 42 960<br />
Source UBOS Statistical Abstract 2002<br />
Beans<br />
Annual Consumption of Beans <strong>in</strong> Metric Tonnes<br />
Population<br />
Annual Per Capita<br />
Consumption (kg) Total (MT)<br />
23,300,000 14.70 342,510<br />
Source: FAO Food Balance Sheet for Ug<strong>and</strong>a 2000<br />
Annual Bean Exports 1995 - 2002<br />
1995 1996 1997 1998 1999 2000 2001 2002<br />
IDEA Volume (MT)* 14,561 18,074 16,639 18,397 27,249 38,526 15,288 30,221<br />
UBOS Volume (MT)** 27,760 5,875 15,829 25,013 6,756<br />
* Source IDEA Project Data<br />
** Source: UBOS Statistical Abstract 2002<br />
44