Crop production data and forecasts system in ... - Foodnet - cgiar
Crop production data and forecasts system in ... - Foodnet - cgiar
Crop production data and forecasts system in ... - Foodnet - cgiar

Create successful ePaper yourself
Turn your PDF publications into a flip-book with our unique Google optimized e-Paper software.
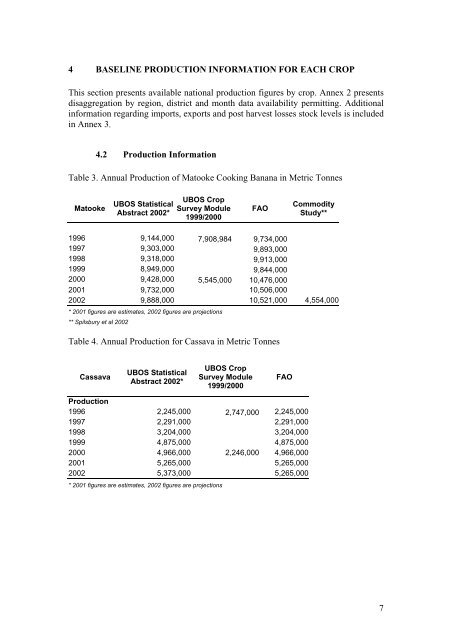
4 BASELINE PRODUCTION INFORMATION FOR EACH CROP<br />
This section presents available national <strong>production</strong> figures by crop. Annex 2 presents<br />
disaggregation by region, district <strong>and</strong> month <strong>data</strong> availability permitt<strong>in</strong>g. Additional<br />
<strong>in</strong>formation regard<strong>in</strong>g imports, exports <strong>and</strong> post harvest losses stock levels is <strong>in</strong>cluded<br />
<strong>in</strong> Annex 3.<br />
4.2 Production Information<br />
Table 3. Annual Production of Matooke Cook<strong>in</strong>g Banana <strong>in</strong> Metric Tonnes<br />
Matooke<br />
UBOS Statistical<br />
Abstract 2002*<br />
UBOS <strong>Crop</strong><br />
Survey Module<br />
1999/2000<br />
FAO<br />
Commodity<br />
Study**<br />
1996 9,144,000 7,908,984 9,734,000<br />
1997 9,303,000 9,893,000<br />
1998 9,318,000 9,913,000<br />
1999 8,949,000 9,844,000<br />
2000 9,428,000 5,545,000 10,476,000<br />
2001 9,732,000 10,506,000<br />
2002 9,888,000 10,521,000 4,554,000<br />
* 2001 figures are estimates, 2002 figures are projections<br />
** Spilsbury et al 2002<br />
Table 4. Annual Production for Cassava <strong>in</strong> Metric Tonnes<br />
Cassava<br />
UBOS Statistical<br />
Abstract 2002*<br />
UBOS <strong>Crop</strong><br />
Survey Module<br />
1999/2000<br />
FAO<br />
Production<br />
1996 2,245,000 2,747,000 2,245,000<br />
1997 2,291,000 2,291,000<br />
1998 3,204,000 3,204,000<br />
1999 4,875,000 4,875,000<br />
2000 4,966,000 2,246,000 4,966,000<br />
2001 5,265,000 5,265,000<br />
2002 5,373,000 5,265,000<br />
* 2001 figures are estimates, 2002 figures are projections<br />
7