Crop production data and forecasts system in ... - Foodnet - cgiar
Crop production data and forecasts system in ... - Foodnet - cgiar
Crop production data and forecasts system in ... - Foodnet - cgiar

Create successful ePaper yourself
Turn your PDF publications into a flip-book with our unique Google optimized e-Paper software.
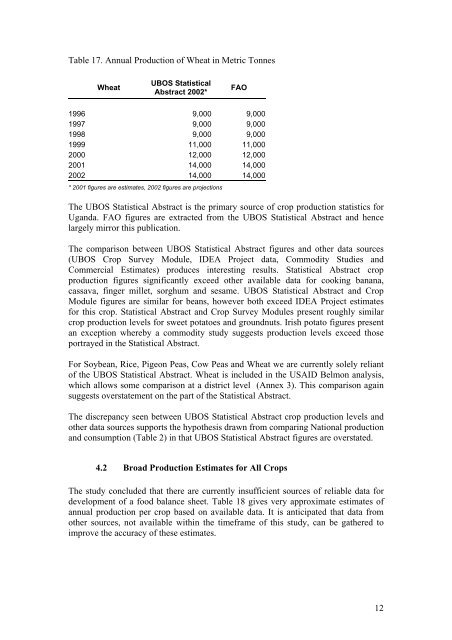
Table 17. Annual Production of Wheat <strong>in</strong> Metric Tonnes<br />
Wheat<br />
UBOS Statistical<br />
Abstract 2002*<br />
FAO<br />
1996 9,000 9,000<br />
1997 9,000 9,000<br />
1998 9,000 9,000<br />
1999 11,000 11,000<br />
2000 12,000 12,000<br />
2001 14,000 14,000<br />
2002 14,000 14,000<br />
* 2001 figures are estimates, 2002 figures are projections<br />
The UBOS Statistical Abstract is the primary source of crop <strong>production</strong> statistics for<br />
Ug<strong>and</strong>a. FAO figures are extracted from the UBOS Statistical Abstract <strong>and</strong> hence<br />
largely mirror this publication.<br />
The comparison between UBOS Statistical Abstract figures <strong>and</strong> other <strong>data</strong> sources<br />
(UBOS <strong>Crop</strong> Survey Module, IDEA Project <strong>data</strong>, Commodity Studies <strong>and</strong><br />
Commercial Estimates) produces <strong>in</strong>terest<strong>in</strong>g results. Statistical Abstract crop<br />
<strong>production</strong> figures significantly exceed other available <strong>data</strong> for cook<strong>in</strong>g banana,<br />
cassava, f<strong>in</strong>ger millet, sorghum <strong>and</strong> sesame. UBOS Statistical Abstract <strong>and</strong> <strong>Crop</strong><br />
Module figures are similar for beans, however both exceed IDEA Project estimates<br />
for this crop. Statistical Abstract <strong>and</strong> <strong>Crop</strong> Survey Modules present roughly similar<br />
crop <strong>production</strong> levels for sweet potatoes <strong>and</strong> groundnuts. Irish potato figures present<br />
an exception whereby a commodity study suggests <strong>production</strong> levels exceed those<br />
portrayed <strong>in</strong> the Statistical Abstract.<br />
For Soybean, Rice, Pigeon Peas, Cow Peas <strong>and</strong> Wheat we are currently solely reliant<br />
of the UBOS Statistical Abstract. Wheat is <strong>in</strong>cluded <strong>in</strong> the USAID Belmon analysis,<br />
which allows some comparison at a district level (Annex 3). This comparison aga<strong>in</strong><br />
suggests overstatement on the part of the Statistical Abstract.<br />
The discrepancy seen between UBOS Statistical Abstract crop <strong>production</strong> levels <strong>and</strong><br />
other <strong>data</strong> sources supports the hypothesis drawn from compar<strong>in</strong>g National <strong>production</strong><br />
<strong>and</strong> consumption (Table 2) <strong>in</strong> that UBOS Statistical Abstract figures are overstated.<br />
4.2 Broad Production Estimates for All <strong>Crop</strong>s<br />
The study concluded that there are currently <strong>in</strong>sufficient sources of reliable <strong>data</strong> for<br />
development of a food balance sheet. Table 18 gives very approximate estimates of<br />
annual <strong>production</strong> per crop based on available <strong>data</strong>. It is anticipated that <strong>data</strong> from<br />
other sources, not available with<strong>in</strong> the timeframe of this study, can be gathered to<br />
improve the accuracy of these estimates.<br />
12