
You also want an ePaper? Increase the reach of your titles
YUMPU automatically turns print PDFs into web optimized ePapers that Google loves.
C-28 Appendix C<br />
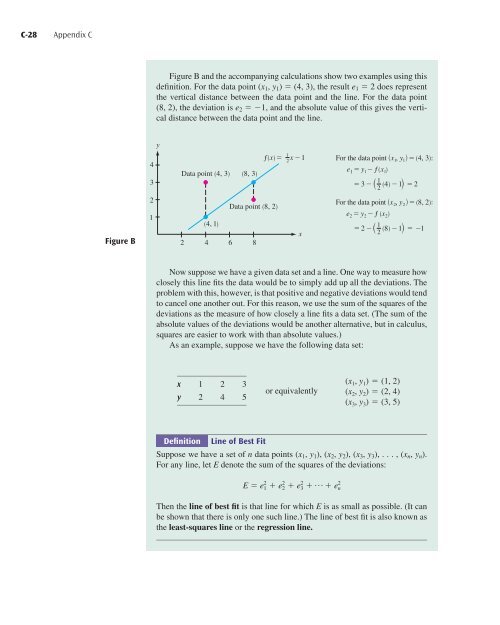
Figure B and the accompanying calculations show two examples using this<br />
definition. For the data point (x 1 , y 1 ) (4, 3), the result e 1 2 does represent<br />
the vertical distance between the data point and the line. For the data point<br />
(8, 2), the deviation is e 2 1, and the absolute value of this gives the vertical<br />
distance between the data point and the line.<br />
y<br />
4<br />
3<br />
Data point (4, 3)<br />
(8, 3)<br />
1<br />
ƒ=<br />
2x-1<br />
For the data point {⁄, › }=(4, 3):<br />
e 1 =›- f (⁄)<br />
1<br />
=3-” (4)-1’ =2<br />
2<br />
Figure B<br />
2<br />
1<br />
(4, 1)<br />
Data point (8, 2)<br />
2 4 6 8<br />
x<br />
For the data point {¤, fi }=(8, 2):<br />
e 2 =fi-f (x 2 )<br />
1<br />
=2 _ ” (8) _ 1’ = _1<br />
2<br />
Now suppose we have a given data set and a line. One way to measure how<br />
closely this line fits the data would be to simply add up all the deviations. The<br />
problem with this, however, is that positive and negative deviations would tend<br />
to cancel one another out. For this reason, we use the sum of the squares of the<br />
deviations as the measure of how closely a line fits a data set. (The sum of the<br />
absolute values of the deviations would be another alternative, but in calculus,<br />
squares are easier to work with than absolute values.)<br />
As an example, suppose we have the following data set:<br />
x 1 2 3<br />
y 2 4 5<br />
or equivalently<br />
(x 1 , y 1 ) (1, 2)<br />
(x 2 , y 2 ) (2, 4)<br />
(x 3 , y 3 ) (3, 5)<br />
Definition<br />
Line of Best Fit<br />
Suppose we have a set of n data points (x 1 , y 1 ), (x 2 , y 2 ), (x 3 , y 3 ),..., (x n , y n ).<br />
For any line, let E denote the sum of the squares of the deviations:<br />
E e 2 1 e 2 2 e 2 3 p e 2 n<br />
Then the line of best fit is that line for which E is as small as possible. (It can<br />
be shown that there is only one such line.) The line of best fit is also known as<br />
the least-squares line or the regression line.