
You also want an ePaper? Increase the reach of your titles
YUMPU automatically turns print PDFs into web optimized ePapers that Google loves.
C-4 Appendix C<br />
MINI PROJECT<br />
Drawing Conclusions from Visual Evidence<br />
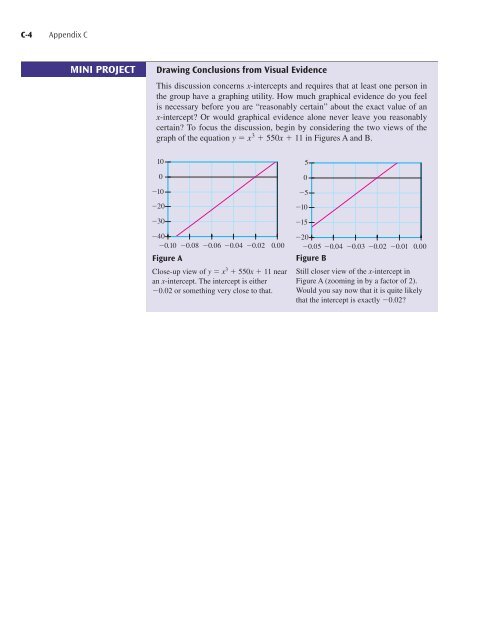
This discussion concerns x-intercepts and requires that at least one person in<br />
the group have a graphing utility. How much graphical evidence do you feel<br />
is necessary before you are “reasonably certain” about the exact value of an<br />
x-intercept? Or would graphical evidence alone never leave you reasonably<br />
certain? To focus the discussion, begin by considering the two views of the<br />
graph of the equation y x 3 550x 11 in Figures A and B.<br />
10<br />
0<br />
_10<br />
_20<br />
_30<br />
_40<br />
_0.10 _0.08 _0.06 _0.04 _0.02 0.00<br />
Figure A<br />
Close-up view of y x 3 550x 11 near<br />
an x-intercept. The intercept is either<br />
0.02 or something very close to that.<br />
5<br />
0<br />
_5<br />
_10<br />
_15<br />
_20<br />
_0.05 _0.04 _0.03 _0.02 _0.01 0.00<br />
Figure B<br />
Still closer view of the x-intercept in<br />
Figure A (zooming in by a factor of 2).<br />
Would you say now that it is quite likely<br />
that the intercept is exactly 0.02?