EXPERIENCEBUSINESS - Harley-Davidson
EXPERIENCEBUSINESS - Harley-Davidson
EXPERIENCEBUSINESS - Harley-Davidson

You also want an ePaper? Increase the reach of your titles
YUMPU automatically turns print PDFs into web optimized ePapers that Google loves.
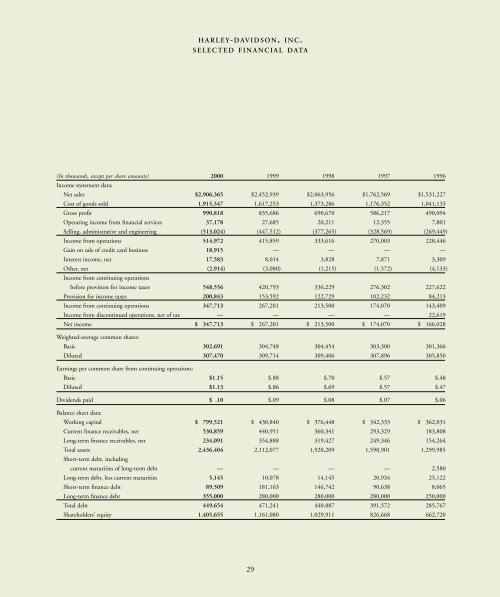
HARLEY- DAVIDSON, INC.<br />
SELECTED FINANCIAL DATA<br />
(In thousands, except per share amounts) 2000 1999 1998 1997 1996<br />
Income statement data:<br />
Net sales $2,906,365 $2,452,939 $2,063,956 $1,762,569 $1,531,227<br />
Cost of goods sold 1,915,547 1,617,253 1,373,286 1,176,352 1,041,133<br />
Gross profit 990,818 835,686 690,670 586,217 490,094<br />
Operating income from financial services 37,178 27,685 20,211 12,355 7,801<br />
Selling, administrative and engineering (513,024) (447,512) (377,265) (328,569) (269,449)<br />
Income from operations 514,972 415,859 333,616 270,003 228,446<br />
Gain on sale of credit card business 18,915 — — — —<br />
Interest income, net 17,583 8,014 3,828 7,871 3,309<br />
Other, net (2,914) (3,080) (1,215) (1,572) (4,133)<br />
Income from continuing operations<br />
before provision for income taxes 548,556 420,793 336,229 276,302 227,622<br />
Provision for income taxes 200,843 153,592 122,729 102,232 84,213<br />
Income from continuing operations 347,713 267,201 213,500 174,070 143,409<br />
Income from discontinued operations, net of tax — — — — 22,619<br />
Net income $ 347,713 $ 267,201 $ 213,500 $ 174,070 $ 166,028<br />
Weighted-average common shares:<br />
Basic 302,691 304,748 304,454 303,300 301,366<br />
Diluted 307,470 309,714 309,406 307,896 305,850<br />
Earnings per common share from continuing operations:<br />
Basic $1.15 $.88 $.70 $.57 $.48<br />
Diluted $1.13 $.86 $.69 $.57 $.47<br />
Dividends paid $ .10 $.09 $.08 $.07 $.06<br />
Balance sheet data:<br />
Working capital $ 799,521 $ 430,840 $ 376,448 $ 342,333 $ 362,031<br />
Current finance receivables, net 530,859 440,951 360,341 293,329 183,808<br />
Long-term finance receivables, net 234,091 354,888 319,427 249,346 154,264<br />
Total assets 2,436,404 2,112,077 1,920,209 1,598,901 1,299,985<br />
Short-term debt, including<br />
current maturities of long-term debt — — — — 2,580<br />
Long-term debt, less current maturities 5,145 10,078 14,145 20,934 25,122<br />
Short-term finance debt 89,509 181,163 146,742 90,638 8,065<br />
Long-term finance debt 355,000 280,000 280,000 280,000 250,000<br />
Total debt 449,654 471,241 440,887 391,572 285,767<br />
Shareholders’ equity 1,405,655 1,161,080 1,029,911 826,668 662,720<br />
29