… and the Pursuit of Happiness - Institute of Economic Affairs
… and the Pursuit of Happiness - Institute of Economic Affairs
… and the Pursuit of Happiness - Institute of Economic Affairs

Create successful ePaper yourself
Turn your PDF publications into a flip-book with our unique Google optimized e-Paper software.
<strong>…</strong> <strong>and</strong> <strong>the</strong> pursuit <strong>of</strong> happiness<br />
subjective wellbeing<br />
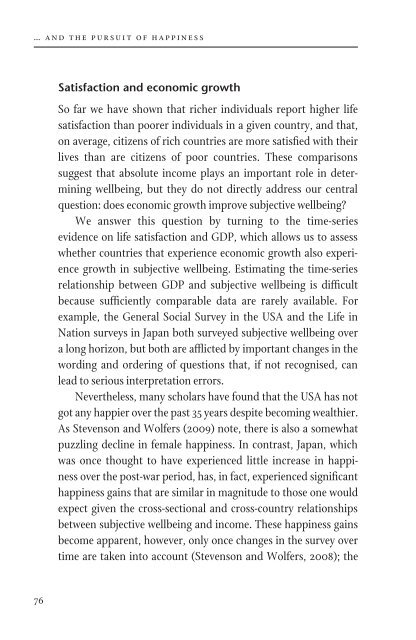
Satisfaction <strong>and</strong> economic growth<br />
So far we have shown that richer individuals report higher life<br />
satisfaction than poorer individuals in a given country, <strong>and</strong> that,<br />
on average, citizens <strong>of</strong> rich countries are more satisfied with <strong>the</strong>ir<br />
lives than are citizens <strong>of</strong> poor countries. These comparisons<br />
suggest that absolute income plays an important role in determining<br />
wellbeing, but <strong>the</strong>y do not directly address our central<br />
question: does economic growth improve subjective wellbeing?<br />
We answer this question by turning to <strong>the</strong> time-series<br />
evidence on life satisfaction <strong>and</strong> GDP, which allows us to assess<br />
whe<strong>the</strong>r countries that experience economic growth also experience<br />
growth in subjective wellbeing. Estimating <strong>the</strong> time-series<br />
relationship between GDP <strong>and</strong> subjective wellbeing is difficult<br />
because sufficiently comparable data are rarely available. For<br />
example, <strong>the</strong> General Social Survey in <strong>the</strong> USA <strong>and</strong> <strong>the</strong> Life in<br />
Nation surveys in Japan both surveyed subjective wellbeing over<br />
a long horizon, but both are afflicted by important changes in <strong>the</strong><br />
wording <strong>and</strong> ordering <strong>of</strong> questions that, if not recognised, can<br />
lead to serious interpretation errors.<br />
Never<strong>the</strong>less, many scholars have found that <strong>the</strong> USA has not<br />
got any happier over <strong>the</strong> past 35 years despite becoming wealthier.<br />
As Stevenson <strong>and</strong> Wolfers (2009) note, <strong>the</strong>re is also a somewhat<br />
puzzling decline in female happiness. In contrast, Japan, which<br />
was once thought to have experienced little increase in happiness<br />
over <strong>the</strong> post-war period, has, in fact, experienced significant<br />
happiness gains that are similar in magnitude to those one would<br />
expect given <strong>the</strong> cross-sectional <strong>and</strong> cross-country relationships<br />
between subjective wellbeing <strong>and</strong> income. These happiness gains<br />
become apparent, however, only once changes in <strong>the</strong> survey over<br />
time are taken into account (Stevenson <strong>and</strong> Wolfers, 2008); <strong>the</strong><br />
failure to take account <strong>of</strong> <strong>the</strong>se changes had led many previous<br />
scholars astray (including Easterlin, 1995, 2005a).<br />
We draw on two long-running data sets to examine <strong>the</strong> relationship<br />
between subjective wellbeing <strong>and</strong> economic growth: <strong>the</strong><br />
World Values Survey <strong>and</strong> <strong>the</strong> Eurobarometer. We analyse <strong>the</strong> first<br />
four waves <strong>of</strong> <strong>the</strong> World Values Survey, which span 1980 to 2004<br />
<strong>and</strong> cover 79 distinct countries. Because <strong>the</strong> World Values Survey<br />
added many countries in later waves, however, it is not possible<br />
to make many comparisons <strong>of</strong> a given country. 5 The Eurobarometer<br />
survey has <strong>the</strong> advantage that it has been surveying people<br />
in member nations <strong>of</strong> <strong>the</strong> European Union continually since<br />
1973; it has <strong>the</strong> disadvantage, however, <strong>of</strong> covering only relatively<br />
homogeneous countries. Unlike <strong>the</strong> o<strong>the</strong>r surveys, Eurobarometer<br />
ascertains life satisfaction on a four-point scale. 6<br />
Nine countries were included in <strong>the</strong> original Eurobarometer<br />
sample. Analysing data to 1989, Easterlin (1995) concluded that<br />
<strong>the</strong> data failed to show any relationship between life satisfaction<br />
<strong>and</strong> economic growth. In Figure 5, we present scatter plots <strong>of</strong> life<br />
satisfaction <strong>and</strong> <strong>the</strong> log <strong>of</strong> GDP per capita for <strong>the</strong> nine countries<br />
Easterlin analysed. In <strong>the</strong> figure we include as dark circles <strong>the</strong><br />
original data he analysed; hollow circles denote data that have<br />
subsequently become available through to 2007. The dark circles<br />
by <strong>the</strong>mselves do not always show a strong relationship; over <strong>the</strong><br />
full sample, however, eight <strong>of</strong> <strong>the</strong> nine countries show a positive<br />
5 As noted earlier, some <strong>of</strong> <strong>the</strong> country samples in earlier waves <strong>of</strong> <strong>the</strong> World Values<br />
Survey are not directly comparable with later waves since <strong>the</strong>ir survey frames<br />
were (intentionally) not nationally representative. Our analysis focuses only on<br />
nationally representative samples.<br />
6 For <strong>the</strong> analysis, we keep West Germany <strong>and</strong> East Germany as separate countries.<br />
For fur<strong>the</strong>r details on <strong>the</strong> Eurobarometer <strong>and</strong> our data procedures, see Stevenson<br />
<strong>and</strong> Wolfers (2008).<br />
76 77