… and the Pursuit of Happiness - Institute of Economic Affairs
… and the Pursuit of Happiness - Institute of Economic Affairs
… and the Pursuit of Happiness - Institute of Economic Affairs

You also want an ePaper? Increase the reach of your titles
YUMPU automatically turns print PDFs into web optimized ePapers that Google loves.
<strong>…</strong> <strong>and</strong> <strong>the</strong> pursuit <strong>of</strong> happiness<br />
subjective wellbeing<br />
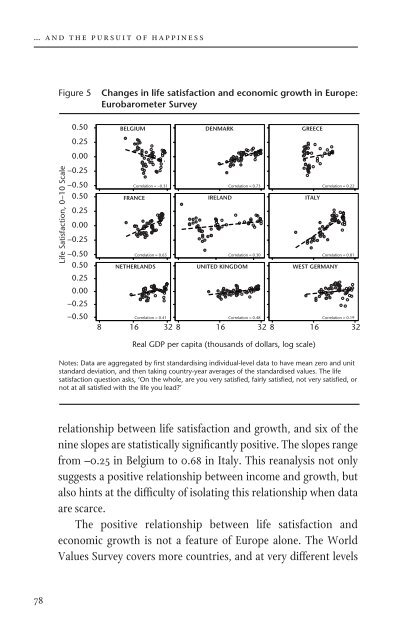
Figure 5<br />
Life Satisfaction, 0−10 Scale<br />
0.50<br />
0.25<br />
0.00<br />
−0.25<br />
−0.50<br />
0.50<br />
0.25<br />
0.00<br />
−0.25<br />
−0.50<br />
0.50<br />
0.25<br />
0.00<br />
−0.25<br />
−0.50<br />
Changes in life satisfaction <strong>and</strong> economic growth in Europe:<br />
Eurobarometer Survey<br />
BELGIUM<br />
Correlation = −0.31<br />
FRANCE<br />
Correlation = 0.63<br />
NETHERLANDS<br />
Correlation = 0.41<br />
DENMARK<br />
IRELAND<br />
Correlation = 0.73<br />
Correlation = 0.30<br />
UNITED KINGDOM<br />
Correlation = 0.48<br />
GREECE<br />
Correlation = 0.22<br />
Correlation = 0.81<br />
Notes: Data are aggregated by first st<strong>and</strong>ardising individual-level data to have mean zero <strong>and</strong> unit<br />
st<strong>and</strong>ard deviation, <strong>and</strong> <strong>the</strong>n taking country-year averages <strong>of</strong> <strong>the</strong> st<strong>and</strong>ardised values. The life<br />
satisfaction question asks, ‘On <strong>the</strong> whole, are you very satisfied, fairly satisfied, not very satisfied, or<br />
not at all satisfied with <strong>the</strong> life you lead?’<br />
relationship between life satisfaction <strong>and</strong> growth, <strong>and</strong> six <strong>of</strong> <strong>the</strong><br />
nine slopes are statistically significantly positive. The slopes range<br />
from –0.25 in Belgium to 0.68 in Italy. This reanalysis not only<br />
suggests a positive relationship between income <strong>and</strong> growth, but<br />
also hints at <strong>the</strong> difficulty <strong>of</strong> isolating this relationship when data<br />
Source: Statistics from <strong>Institute</strong> for Fiscal Studies (2010)<br />
are scarce.<br />
The positive relationship between life satisfaction <strong>and</strong><br />
economic growth is not a feature <strong>of</strong> Europe alone. The World<br />
Values Survey covers more countries, <strong>and</strong> at very different levels<br />
ITALY<br />
WEST GERMANY<br />
8 16 32 8 16 32 8 16 32<br />
Real GDP per capita (thous<strong>and</strong>s <strong>of</strong> dollars, log scale)<br />
Correlation = 0.19<br />
1<br />
2<br />
3<br />
4<br />
5<br />
6<br />
7<br />
8<br />
9<br />
10<br />
11<br />
12<br />
13<br />
14<br />
15<br />
16<br />
17<br />
18<br />
19<br />
20<br />
21<br />
22<br />
23<br />
24<br />
25<br />
26<br />
27<br />
28<br />
29<br />
30<br />
<strong>of</strong> development. This allows us to see whe<strong>the</strong>r populations<br />
become more satisfied as <strong>the</strong>ir countries transition from low to<br />
moderate income as well as from moderate to high income. The<br />
evidence from this data suggests that <strong>the</strong>re is a positive association<br />
between changes in subjective wellbeing <strong>and</strong> changes<br />
in income. It also seems clear, however, that life satisfaction is<br />
more sensitive to short-run changes in income than to long-run<br />
changes, suggesting that business-cycle variation may be driving<br />
some <strong>of</strong> <strong>the</strong> association. An alternative interpretation is that,<br />
over time, individuals adapt to <strong>the</strong>ir new circumstances or <strong>the</strong>ir<br />
aspirations change, so that, even though <strong>the</strong>ir material welfare is<br />
increasing <strong>the</strong>ir subjective wellbeing, gains from <strong>the</strong>se increases<br />
recede over time.<br />
There are also some interesting outliers from an examination<br />
<strong>of</strong> <strong>the</strong> broader data. Korea, for example, had only a modest change<br />
in subjective wellbeing <strong>and</strong> a very large increase in GDP; Hungary<br />
experienced very little growth, but had a serious decline in life<br />
satisfaction. In <strong>the</strong> regression results reported below, we include<br />
<strong>the</strong>se outliers, but it is clear that excluding <strong>the</strong>m could change our<br />
estimates. Overall, our work provides strong evidence <strong>of</strong> a relationship<br />
between economic growth <strong>and</strong> growth in wellbeing. The<br />
satisfaction–income gradient is 0.51 in <strong>the</strong> World Values Survey<br />
<strong>and</strong> 0.17 in <strong>the</strong> Eurobarometer, as we report in column 3 <strong>of</strong> Table<br />
1. Our data reject <strong>the</strong> hypo<strong>the</strong>sis that it is relative ra<strong>the</strong>r than<br />
absolute income which determines wellbeing. The results are not<br />
substantially affected by outliers.<br />
In obtaining <strong>the</strong>se estimates, however, we have drawn on<br />
all <strong>the</strong> variation in GDP in our sample, including possibly highfrequency<br />
changes to which individuals do not have a chance to<br />
adapt. If adaptation occurs slowly, it would be better to focus on<br />
78 79