… and the Pursuit of Happiness - Institute of Economic Affairs
… and the Pursuit of Happiness - Institute of Economic Affairs
… and the Pursuit of Happiness - Institute of Economic Affairs

You also want an ePaper? Increase the reach of your titles
YUMPU automatically turns print PDFs into web optimized ePapers that Google loves.
<strong>…</strong> <strong>and</strong> <strong>the</strong> pursuit <strong>of</strong> happiness<br />
subjective wellbeing<br />
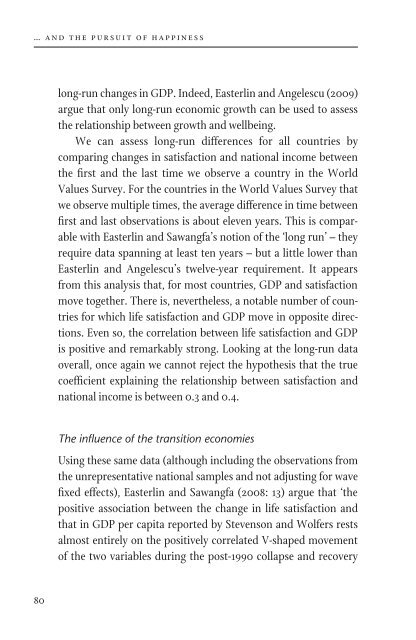
long-run changes in GDP. Indeed, Easterlin <strong>and</strong> Angelescu (2009)<br />
argue that only long-run economic growth can be used to assess<br />
<strong>the</strong> relationship between growth <strong>and</strong> wellbeing.<br />
We can assess long-run differences for all countries by<br />
comparing changes in satisfaction <strong>and</strong> national income between<br />
<strong>the</strong> first <strong>and</strong> <strong>the</strong> last time we observe a country in <strong>the</strong> World<br />
Values Survey. For <strong>the</strong> countries in <strong>the</strong> World Values Survey that<br />
we observe multiple times, <strong>the</strong> average difference in time between<br />
first <strong>and</strong> last observations is about eleven years. This is comparable<br />
with Easterlin <strong>and</strong> Sawangfa’s notion <strong>of</strong> <strong>the</strong> ‘long run’ – <strong>the</strong>y<br />
require data spanning at least ten years – but a little lower than<br />
Easterlin <strong>and</strong> Angelescu’s twelve-year requirement. It appears<br />
from this analysis that, for most countries, GDP <strong>and</strong> satisfaction<br />
move toge<strong>the</strong>r. There is, never<strong>the</strong>less, a notable number <strong>of</strong> countries<br />
for which life satisfaction <strong>and</strong> GDP move in opposite directions.<br />
Even so, <strong>the</strong> correlation between life satisfaction <strong>and</strong> GDP<br />
is positive <strong>and</strong> remarkably strong. Looking at <strong>the</strong> long-run data<br />
overall, once again we cannot reject <strong>the</strong> hypo<strong>the</strong>sis that <strong>the</strong> true<br />
coefficient explaining <strong>the</strong> relationship between satisfaction <strong>and</strong><br />
national income is between 0.3 <strong>and</strong> 0.4.<br />
The influence <strong>of</strong> <strong>the</strong> transition economies<br />
Using <strong>the</strong>se same data (although including <strong>the</strong> observations from<br />
<strong>the</strong> unrepresentative national samples <strong>and</strong> not adjusting for wave<br />
fixed effects), Easterlin <strong>and</strong> Sawangfa (2008: 13) argue that ‘<strong>the</strong><br />
positive association between <strong>the</strong> change in life satisfaction <strong>and</strong><br />
that in GDP per capita reported by Stevenson <strong>and</strong> Wolfers rests<br />
almost entirely on <strong>the</strong> positively correlated V-shaped movement<br />
<strong>of</strong> <strong>the</strong> two variables during <strong>the</strong> post-1990 collapse <strong>and</strong> recovery<br />
Figure 6<br />
Change in satisfaction, relative to country <strong>and</strong> wave fixed effects<br />
0.4<br />
0.2<br />
0.0<br />
−0.2<br />
−0.4<br />
−0.6<br />
Long differences in life satisfaction <strong>and</strong> log GDP,<br />
World Values Survey<br />
RUS<br />
LTU<br />
KOR Offscale<br />
MDA<br />
VEN ITA<br />
(1, 0.33)<br />
ESP<br />
CZE<br />
MEX<br />
BGR UKR<br />
AUT<br />
FRA FIN BRA<br />
IRL<br />
EST<br />
MLT<br />
USA<br />
ISL<br />
NOR<br />
AUS<br />
JPN<br />
POL<br />
LVA<br />
SWE GBR<br />
SCG<br />
SVK<br />
BLR<br />
ROM<br />
TUR<br />
HUN<br />
MKD<br />
in <strong>the</strong> transition countries’. In order to investigate this claim,<br />
we separately estimated our panel regressions <strong>and</strong> long differences<br />
for <strong>the</strong> sample <strong>of</strong> transition countries only <strong>and</strong> <strong>the</strong>n for all<br />
o<strong>the</strong>r World Values Survey nations. While breaking <strong>the</strong> sample<br />
apart like this reduces our statistical precision, <strong>the</strong> key inferences<br />
remain <strong>the</strong> same in both samples: <strong>the</strong> influence <strong>of</strong> GDP growth<br />
on satisfaction is positive, statistically significantly different from<br />
SVN<br />
KOR<br />
y = 0.47*ln(x) [se=0.13]<br />
Correlation=0.54<br />
−.5 −.25 0 .25 .5<br />
Change in log GDP, relative to country <strong>and</strong> wave fixed effects<br />
Note: Data are aggregated by first st<strong>and</strong>ardising individual-level data to have mean zero <strong>and</strong> unit<br />
st<strong>and</strong>ard deviation, <strong>and</strong> <strong>the</strong>n taking country-year averages <strong>of</strong> <strong>the</strong> st<strong>and</strong>ardised values. Selected<br />
countries only have been marked.<br />
80 81