2001 Annual Report - Unibail-Rodamco
2001 Annual Report - Unibail-Rodamco
2001 Annual Report - Unibail-Rodamco

You also want an ePaper? Increase the reach of your titles
YUMPU automatically turns print PDFs into web optimized ePapers that Google loves.
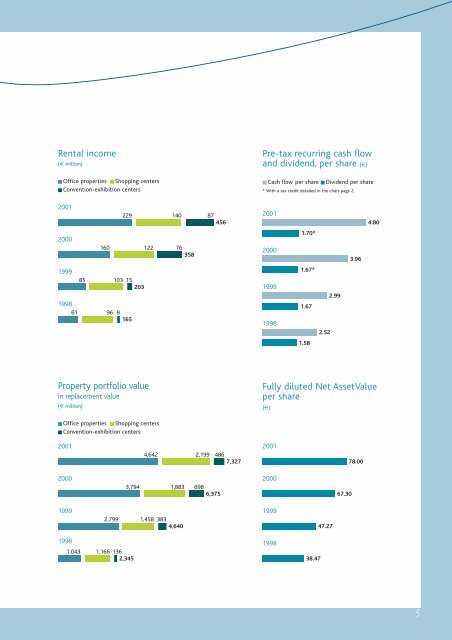
Rental income<br />
(€ million)<br />
■ Office properties ■ Shopping centers<br />
■ Convention-exhibition centers<br />
Pre-tax recurring cash flow<br />
and dividend, per share (€)<br />
■ Cash flow per share ■ Dividend per share<br />
* With a tax credit detailed in the chart page 2.<br />
<strong>2001</strong><br />
229 140 87<br />
456<br />
<strong>2001</strong><br />
4.80<br />
2000<br />
160 122 76<br />
358<br />
2000<br />
1.70*<br />
3.96<br />
1999<br />
85 103 15<br />
203<br />
1998<br />
61 96 8<br />
165<br />
1999<br />
1998<br />
1.67*<br />
1.67<br />
2.52<br />
2.99<br />
1.58<br />
Property portfolio value<br />
in replacement value<br />
(€ million)<br />
Fully diluted Net AssetValue<br />
per share<br />
(€)<br />
■ Office properties ■ Shopping centers<br />
■ Convention-exhibition centers<br />
<strong>2001</strong><br />
4,642 2,199 486<br />
7,327<br />
<strong>2001</strong><br />
78.00<br />
2000<br />
3,794 1,883 698<br />
6,375<br />
2000<br />
67.30<br />
1999<br />
2,799 1,458 383<br />
4,640<br />
1999<br />
47.27<br />
1998<br />
1,043 1,166 136<br />
2,345<br />
1998<br />
38.47<br />
3