2001 Annual Report - Unibail-Rodamco
2001 Annual Report - Unibail-Rodamco
2001 Annual Report - Unibail-Rodamco

You also want an ePaper? Increase the reach of your titles
YUMPU automatically turns print PDFs into web optimized ePapers that Google loves.
CONSOLIDATED FINANCIAL STATEMENTS<br />
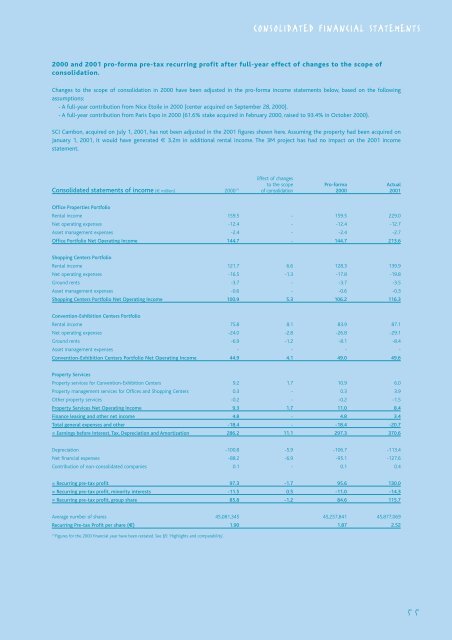
2000 and <strong>2001</strong> pro-forma pre-tax recurring profit after full-year effect of changes to the scope of<br />
consolidation.<br />
Changes to the scope of consolidation in 2000 have been adjusted in the pro-forma income statements below, based on the following<br />
assumptions:<br />
- A full-year contribution from Nice Etoile in 2000 (center acquired on September 28, 2000).<br />
- A full-year contribution from Paris Expo in 2000 (61.6% stake acquired in February 2000, raised to 93.4% in October 2000).<br />
SCI Cambon, acquired on July 1, <strong>2001</strong>, has not been adjusted in the <strong>2001</strong> figures shown here. Assuming the property had been acquired on<br />
January 1, <strong>2001</strong>, it would have generated € 3.2m in additional rental income. The 3M project has had no impact on the <strong>2001</strong> income<br />
statement.<br />
Effect of changes<br />
to the scope Pro-forma Actual<br />
Consolidated statements of income (€ million) 2000 (1) of consolidation 2000 <strong>2001</strong><br />
Office Properties Portfolio<br />
Rental income 159.5 - 159.5 229.0<br />
Net operating expenses -12.4 - -12.4 -12.7<br />
Asset management expenses -2.4 - -2.4 -2.7<br />
Office Portfolio Net Operating Income 144.7 - 144.7 213.6<br />
Shopping Centers Portfolio<br />
Rental income 121.7 6.6 128.3 139.9<br />
Net operating expenses -16.5 -1.3 -17.8 -19.8<br />
Ground rents -3.7 - -3.7 -3.5<br />
Asset management expenses -0.6 - -0.6 -0.3<br />
Shopping Centers Portfolio Net Operating Income 100.9 5.3 106.2 116.3<br />
Convention-Exhibition Centers Portfolio<br />
Rental income 75.8 8.1 83.9 87.1<br />
Net operating expenses -24.0 -2.8 -26.8 -29.1<br />
Ground rents -6.9 -1.2 -8.1 -8.4<br />
Asset management expenses - - - -<br />
Convention-Exhibition Centers Portfolio Net Operating Income 44.9 4.1 49.0 49.6<br />
Property Services<br />
Property services for Convention-Exhibition Centers 9.2 1.7 10.9 6.0<br />
Property management services for Offices and Shopping Centers 0.3 - 0.3 3.9<br />
Other property services -0.2 - -0.2 -1.5<br />
Property Services Net Operating Income 9.3 1.7 11.0 8.4<br />
Finance leasing and other net income 4.8 - 4.8 3.4<br />
Total general expenses and other -18.4 - -18.4 -20.7<br />
= Earnings before Interest, Tax, Depreciation and Amortization 286.2 11.1 297.3 370.6<br />
Depreciation -100.8 -5.9 -106.7 -113.4<br />
Net financial expenses -88.2 -6.9 -95.1 -127.6<br />
Contribution of non-consolidated companies 0.1 - 0.1 0.4<br />
= Recurring pre-tax profit 97.3 -1.7 95.6 130.0<br />
= Recurring pre-tax profit, minority interests -11.5 0.5 -11.0 -14.3<br />
= Recurring pre-tax profit, group share 85.8 -1.2 84.6 115.7<br />
Average number of shares 45,081,345 45,257,841 45,877,069<br />
Recurring Pre-tax Profit per share (€) 1.90 1.87 2.52<br />
(1)<br />
Figures for the 2000 financial year have been restated. See §5: ‘Highlights and comparability’.<br />
55