Download - RM plc
Download - RM plc
Download - RM plc

Create successful ePaper yourself
Turn your PDF publications into a flip-book with our unique Google optimized e-Paper software.
To see an overview for a different group, click the group button that displays the name of the desired<br />
group. The graph will change accordingly to display the data for the selected group. (Settings applied in<br />
each tab in the dashboard are independent of each other to allow flexibility in comparing data.)<br />
Progress shows which national curriculum levels pupils have mastered during a selected time period.<br />
Clicking on ‘Compare pupils’ opens a pop-up window, allowing the teacher to select up to four pupils to<br />
compare on the graph. Pupils’ names are shown at the top of the graph with a colour key to identify a<br />
pupil on the graph and an ‘x’ button to remove the pupil from the graph. A node on a pupil line<br />
represents a session – rolling over a node on a pupil line on the graph will show the date of the session.<br />
Attainment shows how each pupil is getting on, listing their estimated start level, their level mastered,<br />
the total time they have spent on the activities and the number of problem skills. The start and end date<br />
can also be selected.<br />
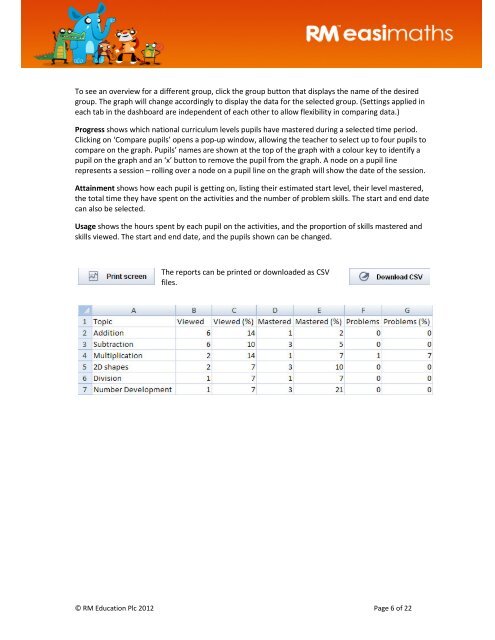
Usage shows the hours spent by each pupil on the activities, and the proportion of skills mastered and<br />
skills viewed. The start and end date, and the pupils shown can be changed.<br />
The reports can be printed or downloaded as CSV<br />
files.<br />
© <strong>RM</strong> Education Plc 2012 Page 6 of 22