Image sensor datasheet (PDF)
Image sensor datasheet (PDF)
Image sensor datasheet (PDF)

You also want an ePaper? Increase the reach of your titles
YUMPU automatically turns print PDFs into web optimized ePapers that Google loves.
Electro-Optical for KAI-0373-ABA Monochrome with Microlens<br />
Description Symbol Min. Nom. Max. Units Notes<br />
Saturation Exposure Esat 0.044 µJ/cm 2 1<br />
Peak Quantum Efficiency QE 35 % 2<br />
Photoresponse Non-uniformity PRNU 2.0 % rms 3<br />
Photoresponse Non-linearity PRNL 2.0 %<br />
Photoresponse Shading Rs 10 % 4<br />
Notes:<br />
1. For λ = 530nm wavelength, and Nsat= 55ke -<br />
2. Refer to typical values from Figure 8: Monochrome with Microlens Quantum Efficiency.<br />
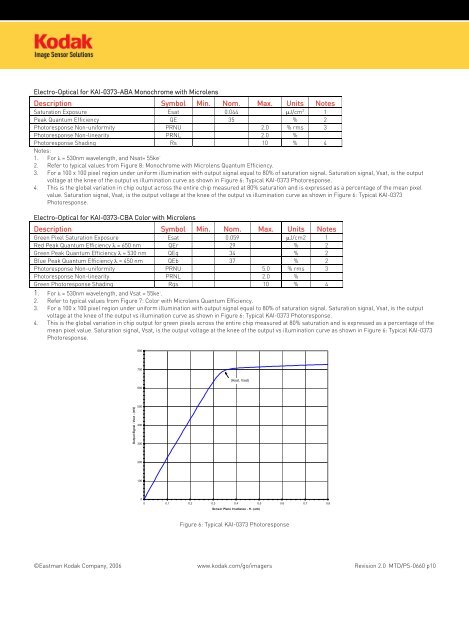
3. For a 100 x 100 pixel region under uniform illumination with output signal equal to 80% of saturation signal. Saturation signal, Vsat, is the output<br />
voltage at the knee of the output vs illumination curve as shown in Figure 6: Typical KAI-0373 Photoresponse.<br />
4. This is the global variation in chip output across the entire chip measured at 80% saturation and is expressed as a percentage of the mean pixel<br />
value. Saturation signal, Vsat, is the output voltage at the knee of the output vs illumination curve as shown in Figure 6: Typical KAI-0373<br />
Photoresponse.<br />
Electro-Optical for KAI-0373-CBA Color with Microlens<br />
Description Symbol Min. Nom. Max. Units Notes<br />
Green Pixel Saturation Exposure Esat 0.059 µJ/cm2 1<br />
Red Peak Quantum Efficiency λ = 650 nm QEr 29 % 2<br />
Green Peak Quantum Efficiency λ = 530 nm QEg 34 % 2<br />
Blue Peak Quantum Efficiency λ = 450 nm QEb 37 % 2<br />
Photoresponse Non-uniformity PRNU 5.0 % rms 3<br />
Photoresponse Non-linearity PRNL 2.0 %<br />
Green Photoresponse Shading Rgs 10 % 4<br />
1. For λ = 530nm wavelength, and Vsat = 55ke - .<br />
2. Refer to typical values from Figure 7: Color with Microlens Quantum Efficiency.<br />
3. For a 100 x 100 pixel region under uniform illumination with output signal equal to 80% of saturation signal. Saturation signal, Vsat, is the output<br />
voltage at the knee of the output vs illumination curve as shown in Figure 6: Typical KAI-0373 Photoresponse.<br />
4. This is the global variation in chip output for green pixels across the entire chip measured at 80% saturation and is expressed as a percentage of the<br />
mean pixel value. Saturation signal, Vsat, is the output voltage at the knee of the output vs illumination curve as shown in Figure 6: Typical KAI-0373<br />
Photoresponse.<br />
800<br />
700<br />
600<br />
(Hsat, Vsat)<br />
Output Signal - Vout - (mV)<br />
500<br />
400<br />
300<br />
200<br />
100<br />
0<br />
0 0.1 0.2 0.3 0.4 0.5 0.6 0.7 0.8<br />
Sensor Plane Irradiance - H - (arb)<br />
Figure 6: Typical KAI-0373 Photoresponse<br />
©Eastman Kodak Company, 2006 www.kodak.com/go/imagers Revision 2.0 MTD/PS-0660 p10