Proceedings of the Seventh Mountain Lion Workshop
Proceedings of the Seventh Mountain Lion Workshop
Proceedings of the Seventh Mountain Lion Workshop

Create successful ePaper yourself
Turn your PDF publications into a flip-book with our unique Google optimized e-Paper software.
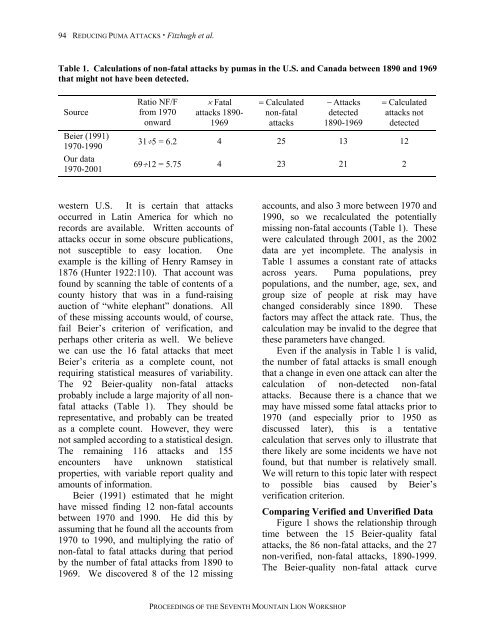
94 REDUCING PUMA ATTACKS · Fitzhugh et al.<br />
Table 1. Calculations <strong>of</strong> non-fatal attacks by pumas in <strong>the</strong> U.S. and Canada between 1890 and 1969<br />
that might not have been detected.<br />
Source<br />
Beier (1991)<br />
1970-1990<br />
Our data<br />
1970-2001<br />
Ratio NF/F<br />
from 1970<br />
onward<br />
× Fatal<br />
attacks 1890-<br />
1969<br />
= Calculated<br />
non-fatal<br />
attacks<br />
− Attacks<br />
detected<br />
1890-1969<br />
PROCEEDINGS OF THE SEVENTH MOUNTAIN LION WORKSHOP<br />
= Calculated<br />
attacks not<br />
detected<br />
31÷5 = 6.2 4 25 13 12<br />
69÷12 = 5.75 4 23 21 2<br />
western U.S. It is certain that attacks<br />
occurred in Latin America for which no<br />
records are available. Written accounts <strong>of</strong><br />
attacks occur in some obscure publications,<br />
not susceptible to easy location. One<br />
example is <strong>the</strong> killing <strong>of</strong> Henry Ramsey in<br />
1876 (Hunter 1922:110). That account was<br />
found by scanning <strong>the</strong> table <strong>of</strong> contents <strong>of</strong> a<br />
county history that was in a fund-raising<br />
auction <strong>of</strong> “white elephant” donations. All<br />
<strong>of</strong> <strong>the</strong>se missing accounts would, <strong>of</strong> course,<br />
fail Beier’s criterion <strong>of</strong> verification, and<br />
perhaps o<strong>the</strong>r criteria as well. We believe<br />
we can use <strong>the</strong> 16 fatal attacks that meet<br />
Beier’s criteria as a complete count, not<br />
requiring statistical measures <strong>of</strong> variability.<br />
The 92 Beier-quality non-fatal attacks<br />
probably include a large majority <strong>of</strong> all nonfatal<br />
attacks (Table 1). They should be<br />
representative, and probably can be treated<br />
as a complete count. However, <strong>the</strong>y were<br />
not sampled according to a statistical design.<br />
The remaining 116 attacks and 155<br />
encounters have unknown statistical<br />
properties, with variable report quality and<br />
amounts <strong>of</strong> information.<br />
Beier (1991) estimated that he might<br />
have missed finding 12 non-fatal accounts<br />
between 1970 and 1990. He did this by<br />
assuming that he found all <strong>the</strong> accounts from<br />
1970 to 1990, and multiplying <strong>the</strong> ratio <strong>of</strong><br />
non-fatal to fatal attacks during that period<br />
by <strong>the</strong> number <strong>of</strong> fatal attacks from 1890 to<br />
1969. We discovered 8 <strong>of</strong> <strong>the</strong> 12 missing<br />
accounts, and also 3 more between 1970 and<br />
1990, so we recalculated <strong>the</strong> potentially<br />
missing non-fatal accounts (Table 1). These<br />
were calculated through 2001, as <strong>the</strong> 2002<br />
data are yet incomplete. The analysis in<br />
Table 1 assumes a constant rate <strong>of</strong> attacks<br />
across years. Puma populations, prey<br />
populations, and <strong>the</strong> number, age, sex, and<br />
group size <strong>of</strong> people at risk may have<br />
changed considerably since 1890. These<br />
factors may affect <strong>the</strong> attack rate. Thus, <strong>the</strong><br />
calculation may be invalid to <strong>the</strong> degree that<br />
<strong>the</strong>se parameters have changed.<br />
Even if <strong>the</strong> analysis in Table 1 is valid,<br />
<strong>the</strong> number <strong>of</strong> fatal attacks is small enough<br />
that a change in even one attack can alter <strong>the</strong><br />
calculation <strong>of</strong> non-detected non-fatal<br />
attacks. Because <strong>the</strong>re is a chance that we<br />
may have missed some fatal attacks prior to<br />
1970 (and especially prior to 1950 as<br />
discussed later), this is a tentative<br />
calculation that serves only to illustrate that<br />
<strong>the</strong>re likely are some incidents we have not<br />
found, but that number is relatively small.<br />
We will return to this topic later with respect<br />
to possible bias caused by Beier’s<br />
verification criterion.<br />
Comparing Verified and Unverified Data<br />
Figure 1 shows <strong>the</strong> relationship through<br />
time between <strong>the</strong> 15 Beier-quality fatal<br />
attacks, <strong>the</strong> 86 non-fatal attacks, and <strong>the</strong> 27<br />
non-verified, non-fatal attacks, 1890-1999.<br />
The Beier-quality non-fatal attack curve