Proceedings of the Seventh Mountain Lion Workshop
Proceedings of the Seventh Mountain Lion Workshop
Proceedings of the Seventh Mountain Lion Workshop

Create successful ePaper yourself
Turn your PDF publications into a flip-book with our unique Google optimized e-Paper software.
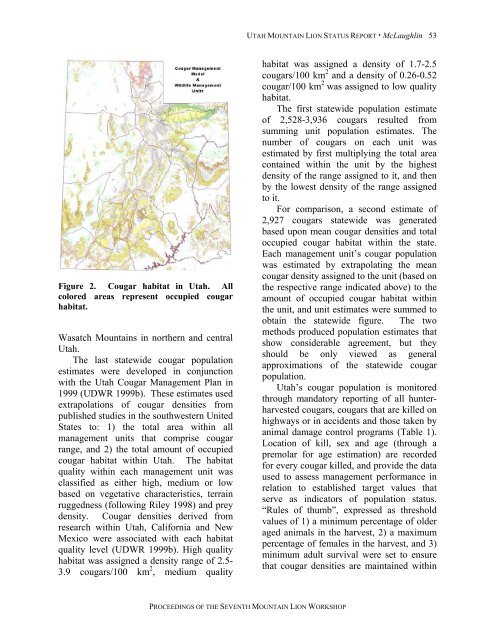
Figure 2. Cougar habitat in Utah. All<br />
colored areas represent occupied cougar<br />
habitat.<br />
Wasatch <strong>Mountain</strong>s in nor<strong>the</strong>rn and central<br />
Utah.<br />
The last statewide cougar population<br />
estimates were developed in conjunction<br />
with <strong>the</strong> Utah Cougar Management Plan in<br />
1999 (UDWR 1999b). These estimates used<br />
extrapolations <strong>of</strong> cougar densities from<br />
published studies in <strong>the</strong> southwestern United<br />
States to: 1) <strong>the</strong> total area within all<br />
management units that comprise cougar<br />
range, and 2) <strong>the</strong> total amount <strong>of</strong> occupied<br />
cougar habitat within Utah. The habitat<br />
quality within each management unit was<br />
classified as ei<strong>the</strong>r high, medium or low<br />
based on vegetative characteristics, terrain<br />
ruggedness (following Riley 1998) and prey<br />
density. Cougar densities derived from<br />
research within Utah, California and New<br />
Mexico were associated with each habitat<br />
quality level (UDWR 1999b). High quality<br />
habitat was assigned a density range <strong>of</strong> 2.5-<br />
3.9 cougars/100 km 2 , medium quality<br />
UTAH MOUNTAIN LION STATUS REPORT · McLaughlin 53<br />
PROCEEDINGS OF THE SEVENTH MOUNTAIN LION WORKSHOP<br />
habitat was assigned a density <strong>of</strong> 1.7-2.5<br />
cougars/100 km 2 and a density <strong>of</strong> 0.26-0.52<br />
cougar/100 km 2 was assigned to low quality<br />
habitat.<br />
The first statewide population estimate<br />
<strong>of</strong> 2,528-3,936 cougars resulted from<br />
summing unit population estimates. The<br />
number <strong>of</strong> cougars on each unit was<br />
estimated by first multiplying <strong>the</strong> total area<br />
contained within <strong>the</strong> unit by <strong>the</strong> highest<br />
density <strong>of</strong> <strong>the</strong> range assigned to it, and <strong>the</strong>n<br />
by <strong>the</strong> lowest density <strong>of</strong> <strong>the</strong> range assigned<br />
to it.<br />
For comparison, a second estimate <strong>of</strong><br />
2,927 cougars statewide was generated<br />
based upon mean cougar densities and total<br />
occupied cougar habitat within <strong>the</strong> state.<br />
Each management unit’s cougar population<br />
was estimated by extrapolating <strong>the</strong> mean<br />
cougar density assigned to <strong>the</strong> unit (based on<br />
<strong>the</strong> respective range indicated above) to <strong>the</strong><br />
amount <strong>of</strong> occupied cougar habitat within<br />
<strong>the</strong> unit, and unit estimates were summed to<br />
obtain <strong>the</strong> statewide figure. The two<br />
methods produced population estimates that<br />
show considerable agreement, but <strong>the</strong>y<br />
should be only viewed as general<br />
approximations <strong>of</strong> <strong>the</strong> statewide cougar<br />
population.<br />
Utah’s cougar population is monitored<br />
through mandatory reporting <strong>of</strong> all hunterharvested<br />
cougars, cougars that are killed on<br />
highways or in accidents and those taken by<br />
animal damage control programs (Table 1).<br />
Location <strong>of</strong> kill, sex and age (through a<br />
premolar for age estimation) are recorded<br />
for every cougar killed, and provide <strong>the</strong> data<br />
used to assess management performance in<br />
relation to established target values that<br />
serve as indicators <strong>of</strong> population status.<br />
“Rules <strong>of</strong> thumb”, expressed as threshold<br />
values <strong>of</strong> 1) a minimum percentage <strong>of</strong> older<br />
aged animals in <strong>the</strong> harvest, 2) a maximum<br />
percentage <strong>of</strong> females in <strong>the</strong> harvest, and 3)<br />
minimum adult survival were set to ensure<br />
that cougar densities are maintained within