Proceedings of the Seventh Mountain Lion Workshop
Proceedings of the Seventh Mountain Lion Workshop
Proceedings of the Seventh Mountain Lion Workshop

Create successful ePaper yourself
Turn your PDF publications into a flip-book with our unique Google optimized e-Paper software.
CHARACTERISTICS OF COUGAR HARVEST · Martorello and Beausoleil 131<br />
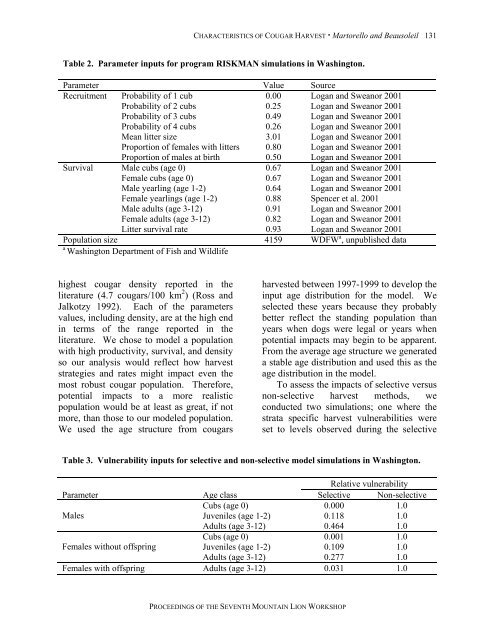
Table 2. Parameter inputs for program RISKMAN simulations in Washington.<br />
Parameter Value Source<br />
Recruitment Probability <strong>of</strong> 1 cub 0.00 Logan and Sweanor 2001<br />
Probability <strong>of</strong> 2 cubs 0.25 Logan and Sweanor 2001<br />
Probability <strong>of</strong> 3 cubs 0.49 Logan and Sweanor 2001<br />
Probability <strong>of</strong> 4 cubs 0.26 Logan and Sweanor 2001<br />
Mean litter size 3.01 Logan and Sweanor 2001<br />
Proportion <strong>of</strong> females with litters 0.80 Logan and Sweanor 2001<br />
Proportion <strong>of</strong> males at birth 0.50 Logan and Sweanor 2001<br />
Survival Male cubs (age 0) 0.67 Logan and Sweanor 2001<br />
Female cubs (age 0) 0.67 Logan and Sweanor 2001<br />
Male yearling (age 1-2) 0.64 Logan and Sweanor 2001<br />
Female yearlings (age 1-2) 0.88 Spencer et al. 2001<br />
Male adults (age 3-12) 0.91 Logan and Sweanor 2001<br />
Female adults (age 3-12) 0.82 Logan and Sweanor 2001<br />
Litter survival rate 0.93 Logan and Sweanor 2001<br />
Population size 4159 WDFW a , unpublished data<br />
a<br />
Washington Department <strong>of</strong> Fish and Wildlife<br />
highest cougar density reported in <strong>the</strong><br />
literature (4.7 cougars/100 km 2 ) (Ross and<br />
Jalkotzy 1992). Each <strong>of</strong> <strong>the</strong> parameters<br />
values, including density, are at <strong>the</strong> high end<br />
in terms <strong>of</strong> <strong>the</strong> range reported in <strong>the</strong><br />
literature. We chose to model a population<br />
with high productivity, survival, and density<br />
so our analysis would reflect how harvest<br />
strategies and rates might impact even <strong>the</strong><br />
most robust cougar population. Therefore,<br />
potential impacts to a more realistic<br />
population would be at least as great, if not<br />
more, than those to our modeled population.<br />
We used <strong>the</strong> age structure from cougars<br />
PROCEEDINGS OF THE SEVENTH MOUNTAIN LION WORKSHOP<br />
harvested between 1997-1999 to develop <strong>the</strong><br />
input age distribution for <strong>the</strong> model. We<br />
selected <strong>the</strong>se years because <strong>the</strong>y probably<br />
better reflect <strong>the</strong> standing population than<br />
years when dogs were legal or years when<br />
potential impacts may begin to be apparent.<br />
From <strong>the</strong> average age structure we generated<br />
a stable age distribution and used this as <strong>the</strong><br />
age distribution in <strong>the</strong> model.<br />
To assess <strong>the</strong> impacts <strong>of</strong> selective versus<br />
non-selective harvest methods, we<br />
conducted two simulations; one where <strong>the</strong><br />
strata specific harvest vulnerabilities were<br />
set to levels observed during <strong>the</strong> selective<br />
Table 3. Vulnerability inputs for selective and non-selective model simulations in Washington.<br />
Relative vulnerability<br />
Parameter Age class Selective Non-selective<br />
Cubs (age 0) 0.000 1.0<br />
Males<br />
Females without <strong>of</strong>fspring<br />
Juveniles (age 1-2) 0.118 1.0<br />
Adults (age 3-12) 0.464 1.0<br />
Cubs (age 0) 0.001 1.0<br />
Juveniles (age 1-2) 0.109 1.0<br />
Adults (age 3-12) 0.277 1.0<br />
Females with <strong>of</strong>fspring Adults (age 3-12) 0.031 1.0