Proceedings of the Seventh Mountain Lion Workshop
Proceedings of the Seventh Mountain Lion Workshop
Proceedings of the Seventh Mountain Lion Workshop

Create successful ePaper yourself
Turn your PDF publications into a flip-book with our unique Google optimized e-Paper software.
96 REDUCING PUMA ATTACKS · Fitzhugh et al.<br />
Table 2. The effect <strong>of</strong> including non-verified puma attack incidents on <strong>the</strong> non-fatal:fatal attack<br />
ratios before and after 1950, U. S. and Canada.<br />
Data 1890-1949 1950-1999 Difference<br />
Beier-quality only 6 ÷ 4 = 1.5 86 ÷ 12 = 7.2 5.7<br />
Beier-quality & all non-verified 16 ÷ 7 = 2.3 96 ÷ 13 = 7.3 5.0<br />
Beier-quality & non-verified non-fatal only 16 ÷ 4 = 4.0 96 ÷ 12 = 8.0 4.0<br />
fatal attacks did not decrease after that, fatal<br />
attacks increased starting in 1970, bringing<br />
<strong>the</strong> ratios down. Some <strong>of</strong> <strong>the</strong> variation in<br />
Figure 2 is caused by zero values. The nonverified,<br />
non-fatal data (Figure 1) are<br />
approximately <strong>of</strong> <strong>the</strong> same value as <strong>the</strong><br />
Beier-quality fatal data, and <strong>the</strong> curves are<br />
very similar, so we may be justified in<br />
combining <strong>the</strong> non-verified non-fatal data (n<br />
= 23) with <strong>the</strong> Beier-quality non- fatal data<br />
(n = 86). Four non-verified fatal attacks also<br />
were included with <strong>the</strong> 15 verified fatal<br />
attacks to be consistent. Ratios for <strong>the</strong><br />
periods before and after 1950 (Table 2)<br />
show that adding all non-verified incidents<br />
(fatal and non-fatal) increased <strong>the</strong> ratios<br />
slightly; ratios were even greater when only<br />
non-verified, non fatal incidents were added.<br />
The non-verified data also reduced <strong>the</strong><br />
differences between <strong>the</strong> earlier and later<br />
periods. If we assume that <strong>the</strong> underlying<br />
ratio <strong>of</strong> non-fatal to fatal attacks is<br />
consistent across years, it appears that<br />
excluding non-verified data changes <strong>the</strong><br />
ratios. The changes represent bias if we are<br />
justified in using <strong>the</strong> non-verified data.<br />
Beier’s (1991) calculation <strong>of</strong> ratios from<br />
1970-1990, to estimate missing non-fatal<br />
attacks prior to 1970, assumed a constant<br />
relationship. It seems logical that we have<br />
detected a larger proportion <strong>of</strong> <strong>the</strong> actual<br />
non-fatal attacks in recent years, and <strong>the</strong><br />
data seem to indicate that this is so (Figures<br />
1-3). However, some biological,<br />
demographic, and cultural differences may<br />
have caused a change in ratios not related to<br />
PROCEEDINGS OF THE SEVENTH MOUNTAIN LION WORKSHOP<br />
reporting frequency. These changes have to<br />
do with changes in persecution <strong>of</strong> pumas,<br />
especially before, during, and after World<br />
Wars I and II, <strong>the</strong> number <strong>of</strong> people using<br />
puma habitat, changes in <strong>the</strong> degree <strong>of</strong> puma<br />
habituation to humans, changes in <strong>the</strong><br />
proportion <strong>of</strong> children versus adults exposed<br />
to pumas, and changes in <strong>the</strong> inclination or<br />
ability <strong>of</strong> people to report incidents. We<br />
believe <strong>the</strong> underlying non-fatal to fatal ratio<br />
may have changed about <strong>the</strong> middle <strong>of</strong> <strong>the</strong><br />
20 th century, but measurement <strong>of</strong> this<br />
potential change is confused by changes in<br />
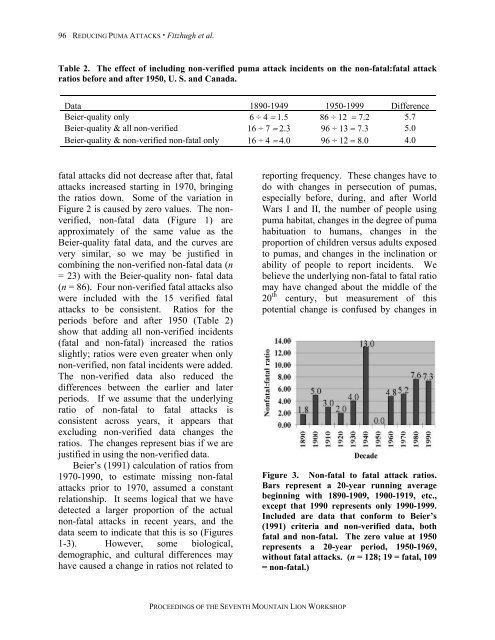
Figure 3. Non-fatal to fatal attack ratios.<br />
Bars represent a 20-year running average<br />
beginning with 1890-1909, 1900-1919, etc.,<br />
except that 1990 represents only 1990-1999.<br />
Included are data that conform to Beier’s<br />
(1991) criteria and non-verified data, both<br />
fatal and non-fatal. The zero value at 1950<br />
represents a 20-year period, 1950-1969,<br />
without fatal attacks. (n = 128; 19 = fatal, 109<br />
= non-fatal.)