Proceedings of the Seventh Mountain Lion Workshop
Proceedings of the Seventh Mountain Lion Workshop
Proceedings of the Seventh Mountain Lion Workshop

Create successful ePaper yourself
Turn your PDF publications into a flip-book with our unique Google optimized e-Paper software.
26 IDAHO MOUNTAIN LION STATUS REPORT · Nadeau<br />
<strong>Lion</strong> Harvest<br />
350<br />
300<br />
250<br />
200<br />
150<br />
100<br />
50<br />
0<br />
1960<br />
1962<br />
1964<br />
1966<br />
1968<br />
1970<br />
1972<br />
1974<br />
1976<br />
Unregulated Harvest Regulated<br />
1978<br />
1980<br />
Figure 2. Unregulated mountain lion harvest<br />
from 1960-71, and regulated harvest from<br />
1972 -1981.<br />
Return Wilderness from 1964-1973 added<br />
significantly to our knowledge. As a result<br />
<strong>of</strong> <strong>the</strong> research, <strong>the</strong> mountain lion was<br />
reclassified as a big game species in 1972.<br />
Harvest was <strong>the</strong>n able to be regulated and<br />
resulted in some closed units, bag limits, and<br />
shortened seasons. Mandatory reporting<br />
was started in 1973, and a tag has been<br />
required since 1975.<br />
Populations <strong>of</strong> elk and deer continued to<br />
increase across <strong>the</strong> state during <strong>the</strong> 1980’s<br />
and early 1990’s, and <strong>the</strong> resulting mountain<br />
lion population did as well. The apparent<br />
increase in lion populations allowed <strong>the</strong><br />
department to increase opportunity for<br />
harvest. Harvest continued to increase as a<br />
result <strong>of</strong> liberalized seasons and increased<br />
populations and peaked in 1997 (Figure 3).<br />
DISTRIBUTION AND ABUNDANCE<br />
<strong>Lion</strong>s were distributed across most <strong>of</strong> <strong>the</strong><br />
suitable habitat in <strong>the</strong> state (Figure 4).<br />
Management tended to keep lion<br />
populations at a low density in developed<br />
areas or areas with high road density.<br />
However, most <strong>of</strong> <strong>the</strong> areas that received<br />
high harvest lay adjacent to lightly roaded<br />
reservoir areas that seemed to continue to<br />
provide dispersing animals. Distribution<br />
900<br />
800<br />
700<br />
600<br />
500<br />
400<br />
300<br />
200<br />
100<br />
0<br />
1982<br />
1984<br />
1986<br />
1988<br />
1990<br />
PROCEEDINGS OF THE SEVENTH MOUNTAIN LION WORKSHOP<br />
Harvest<br />
1992<br />
Year<br />
1994<br />
1996<br />
1998<br />
2000<br />
<strong>Lion</strong> Harvest<br />
Figure 3. Statewide mountain lion harvest.<br />
The year on <strong>the</strong> x-axis represents <strong>the</strong> date <strong>the</strong><br />
season started, i.e. seasons run from fall<br />
through spring.<br />
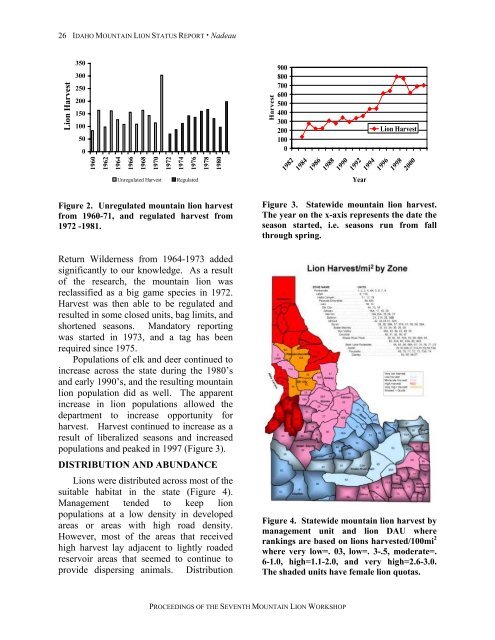
Figure 4. Statewide mountain lion harvest by<br />
management unit and lion DAU where<br />
rankings are based on lions harvested/100mi 2<br />
where very low=. 03, low=. 3-.5, moderate=.<br />
6-1.0, high=1.1-2.0, and very high=2.6-3.0.<br />
The shaded units have female lion quotas.