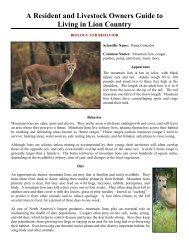
Proceedings of the Seventh Mountain Lion Workshop
Proceedings of the Seventh Mountain Lion Workshop
Proceedings of the Seventh Mountain Lion Workshop

Create successful ePaper yourself
Turn your PDF publications into a flip-book with our unique Google optimized e-Paper software.
DISPERSAL IN MALE PUMAS · Laundré and Hernández 155<br />
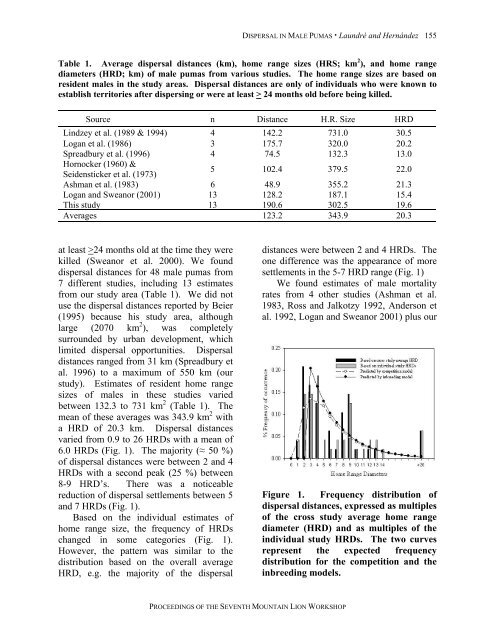
Table 1. Average dispersal distances (km), home range sizes (HRS; km 2 ), and home range<br />
diameters (HRD; km) <strong>of</strong> male pumas from various studies. The home range sizes are based on<br />
resident males in <strong>the</strong> study areas. Dispersal distances are only <strong>of</strong> individuals who were known to<br />
establish territories after dispersing or were at least > 24 months old before being killed.<br />
Source n Distance H.R. Size HRD<br />
Lindzey et al. (1989 & 1994) 4 142.2 731.0 30.5<br />
Logan et al. (1986) 3 175.7 320.0 20.2<br />
Spreadbury et al. (1996) 4 74.5 132.3 13.0<br />
Hornocker (1960) &<br />
Seidensticker et al. (1973)<br />
5 102.4 379.5 22.0<br />
Ashman et al. (1983) 6 48.9 355.2 21.3<br />
Logan and Sweanor (2001) 13 128.2 187.1 15.4<br />
This study 13 190.6 302.5 19.6<br />
Averages 123.2 343.9 20.3<br />
at least >24 months old at <strong>the</strong> time <strong>the</strong>y were<br />
killed (Sweanor et al. 2000). We found<br />
dispersal distances for 48 male pumas from<br />
7 different studies, including 13 estimates<br />
from our study area (Table 1). We did not<br />
use <strong>the</strong> dispersal distances reported by Beier<br />
(1995) because his study area, although<br />
large (2070 km 2 ), was completely<br />
surrounded by urban development, which<br />
limited dispersal opportunities. Dispersal<br />
distances ranged from 31 km (Spreadbury et<br />
al. 1996) to a maximum <strong>of</strong> 550 km (our<br />
study). Estimates <strong>of</strong> resident home range<br />
sizes <strong>of</strong> males in <strong>the</strong>se studies varied<br />
between 132.3 to 731 km 2 (Table 1). The<br />
mean <strong>of</strong> <strong>the</strong>se averages was 343.9 km 2 with<br />
a HRD <strong>of</strong> 20.3 km. Dispersal distances<br />
varied from 0.9 to 26 HRDs with a mean <strong>of</strong><br />
6.0 HRDs (Fig. 1). The majority (≈ 50 %)<br />
<strong>of</strong> dispersal distances were between 2 and 4<br />
HRDs with a second peak (25 %) between<br />
8-9 HRD’s. There was a noticeable<br />
reduction <strong>of</strong> dispersal settlements between 5<br />
and 7 HRDs (Fig. 1).<br />
Based on <strong>the</strong> individual estimates <strong>of</strong><br />
home range size, <strong>the</strong> frequency <strong>of</strong> HRDs<br />
changed in some categories (Fig. 1).<br />
However, <strong>the</strong> pattern was similar to <strong>the</strong><br />
distribution based on <strong>the</strong> overall average<br />
HRD, e.g. <strong>the</strong> majority <strong>of</strong> <strong>the</strong> dispersal<br />
PROCEEDINGS OF THE SEVENTH MOUNTAIN LION WORKSHOP<br />
distances were between 2 and 4 HRDs. The<br />
one difference was <strong>the</strong> appearance <strong>of</strong> more<br />
settlements in <strong>the</strong> 5-7 HRD range (Fig. 1)<br />
We found estimates <strong>of</strong> male mortality<br />
rates from 4 o<strong>the</strong>r studies (Ashman et al.<br />
1983, Ross and Jalkotzy 1992, Anderson et<br />
al. 1992, Logan and Sweanor 2001) plus our<br />
Figure 1. Frequency distribution <strong>of</strong><br />
dispersal distances, expressed as multiples<br />
<strong>of</strong> <strong>the</strong> cross study average home range<br />
diameter (HRD) and as multiples <strong>of</strong> <strong>the</strong><br />
individual study HRDs. The two curves<br />
represent <strong>the</strong> expected frequency<br />
distribution for <strong>the</strong> competition and <strong>the</strong><br />
inbreeding models.