FINANCIAL STATEMENTS - KPN
FINANCIAL STATEMENTS - KPN
FINANCIAL STATEMENTS - KPN

You also want an ePaper? Increase the reach of your titles
YUMPU automatically turns print PDFs into web optimized ePapers that Google loves.
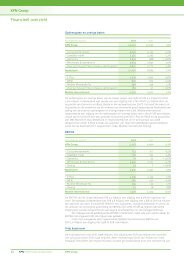
Consolidated Financial Statements<br />
Notes to the Consolidated Statement of Financial Position continued<br />
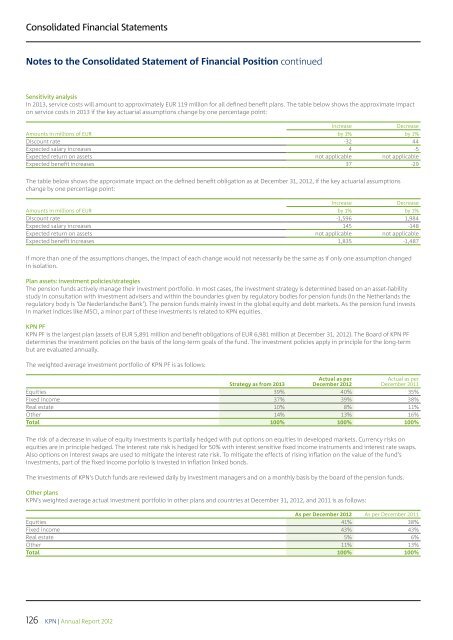
Sensitivity analysis<br />
In 2013, service costs will amount to approximately EUR 119 million for all defined benefit plans. The table below shows the approximate impact<br />
on service costs in 2013 if the key actuarial assumptions change by one percentage point:<br />
Increase<br />
Decrease<br />
Amounts in millions of EUR<br />
by 1% by 1%<br />
Discount rate -32 44<br />
Expected salary increases 4 -5<br />
Expected return on assets not applicable not applicable<br />
Expected benefit increases 37 -29<br />
The table below shows the approximate impact on the defined benefit obligation as at December 31, 2012, if the key actuarial assumptions<br />
change by one percentage point:<br />
Increase<br />
Decrease<br />
Amounts in millions of EUR<br />
by 1% by 1%<br />
Discount rate -1,596 1,984<br />
Expected salary increases 145 -148<br />
Expected return on assets not applicable not applicable<br />
Expected benefit increases 1,835 -1,487<br />
If more than one of the assumptions changes, the impact of each change would not necessarily be the same as if only one assumption changed<br />
in isolation.<br />
Plan assets: investment policies/strategies<br />
The pension funds actively manage their investment portfolio. In most cases, the investment strategy is determined based on an asset-liability<br />
study in consultation with investment advisers and within the boundaries given by regulatory bodies for pension funds (in the Netherlands the<br />
regulatory body is ‘De Nederlandsche Bank’). The pension funds mainly invest in the global equity and debt markets. As the pension fund invests<br />
in market indices like MSCI, a minor part of these investments is related to <strong>KPN</strong> equities.<br />
<strong>KPN</strong> PF<br />
<strong>KPN</strong> PF is the largest plan (assets of EUR 5,891 million and benefit obligations of EUR 6,981 million at December 31, 2012). The Board of <strong>KPN</strong> PF<br />
determines the investment policies on the basis of the long-term goals of the fund. The investment policies apply in principle for the long-term<br />
but are evaluated annually.<br />
The weighted average investment portfolio of <strong>KPN</strong> PF is as follows:<br />
Actual as per<br />
December 2012<br />
Actual as per<br />
December 2011<br />
Strategy as from 2013<br />
Equities 39% 40% 35%<br />
Fixed income 37% 39% 38%<br />
Real estate 10% 8% 11%<br />
Other 14% 13% 16%<br />
Total 100% 100% 100%<br />
The risk of a decrease in value of equity investments is partially hedged with put options on equities in developed markets. Currency risks on<br />
equities are in principle hedged. The interest rate risk is hedged for 50% with interest sensitive fixed income instruments and interest rate swaps.<br />
Also options on interest swaps are used to mitigate the interest rate risk. To mitigate the effects of rising inflation on the value of the fund’s<br />
investments, part of the fixed income porfolio is invested in inflation linked bonds.<br />
The investments of <strong>KPN</strong>’s Dutch funds are reviewed daily by investment managers and on a monthly basis by the board of the pension funds.<br />
Other plans<br />
<strong>KPN</strong>’s weighted average actual investment portfolio in other plans and countries at December 31, 2012, and 2011 is as follows:<br />
As per December 2012 As per December 2011<br />
Equities 41% 38%<br />
Fixed income 43% 43%<br />
Real estate 5% 6%<br />
Other 11% 13%<br />
Total 100% 100%<br />
126<br />
<strong>KPN</strong> | Annual Report 2012