FINANCIAL STATEMENTS - KPN
FINANCIAL STATEMENTS - KPN
FINANCIAL STATEMENTS - KPN

Create successful ePaper yourself
Turn your PDF publications into a flip-book with our unique Google optimized e-Paper software.
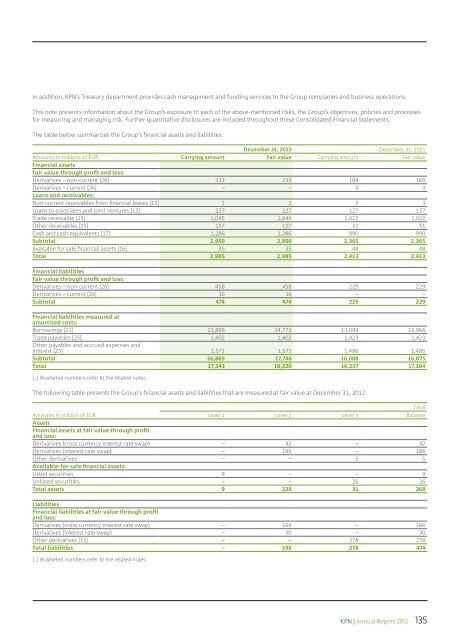
In addition, <strong>KPN</strong>’s Treasury department provides cash management and funding services to the Group companies and business operations.<br />
This note presents information about the Group’s exposure to each of the above-mentioned risks, the Group’s objectives, policies and processes<br />
for measuring and managing risk. Further quantitative disclosures are included throughout these Consolidated Financial Statements.<br />
The table below summarizes the Group’s financial assets and liabilities:<br />
December 31, 2012 December 31, 2011<br />
Amounts in millions of EUR Carrying amount Fair value Carrying amount Fair value<br />
Financial assets<br />
Fair value through profit and loss:<br />
Derivatives – non-current [26] 233 233 169 169<br />
Derivatives – current [26] – – 3 3<br />
Loans and receivables:<br />
Non-current receivables from financial leases [13] 2 2 3 3<br />
Loans to associates and joint ventures [12] 227 227 127 127<br />
Trade receivable [15] 1,045 1,045 1,022 1,022<br />
Other receivables [15] 157 157 51 51<br />
Cash and cash equivalents [17] 1,286 1,286 990 990<br />
Subtotal 2,950 2,950 2,365 2,365<br />
Available for sale financial assets [16] 35 35 48 48<br />
Total 2,985 2,985 2,413 2,413<br />
Financial liabilities<br />
Fair value through profit and loss:<br />
Derivatives – non-current [26] 458 458 229 229<br />
Derivatives – current [26] 16 16 – –<br />
Subtotal 474 474 229 229<br />
Financial liabilities measured at<br />
amortized costs:<br />
Borrowings [21] 13,896 14,773 13,099 13,966<br />
Trade payables [25] 1,402 1,402 1,423 1,423<br />
Other payables and accrued expenses and<br />
interest [25] 1,571 1,571 1,486 1,486<br />
Subtotal 16,869 17,746 16,008 16,875<br />
Total 17,343 18,220 16,237 17,104<br />
[..] Bracketed numbers refer to the related notes.<br />
The following table presents the Group’s financial assets and liabilities that are measured at fair value at December 31, 2012.<br />
Total<br />
Amounts in million of EUR<br />
Level 1 Level 2 Level 3 Balance<br />
Assets<br />
Financial assets at fair value through profit<br />
and loss:<br />
Derivatives (cross currency interest rate swap) – 42 – 42<br />
Derivatives (interest rate swap) – 186 – 186<br />
Other derivatives – – 5 5<br />
Available-for-sale financial assets:<br />
Listed securities 9 – – 9<br />
Unlisted securities – – 26 26<br />
Total assets 9 228 31 268<br />
Liabilities<br />
Financial liabilities at fair value through profit<br />
and loss:<br />
Derivatives (cross currency interest rate swap) – 166 – 166<br />
Derivatives (interest rate swap) – 30 – 30<br />
Other derivatives [12] – – 278 278<br />
Total liabilities – 196 278 474<br />
[..] Bracketed numbers refer to the related notes.<br />
<strong>KPN</strong> | Annual Report 2012 135