intermodal solutions for transalpine freight traffic - Alpine Space ...
intermodal solutions for transalpine freight traffic - Alpine Space ...
intermodal solutions for transalpine freight traffic - Alpine Space ...

Create successful ePaper yourself
Turn your PDF publications into a flip-book with our unique Google optimized e-Paper software.
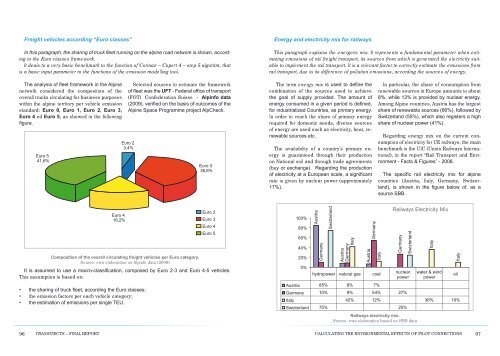
Freight vehicles according “euro classes”<br />
In this paragraph, the sharing of truck fleet running on the alpine road network is shown, according<br />
to the Euro classes framework.<br />
It deals to a very basic benchmark to the function of Corinair – Copert 4 – step 5 algoritm, that<br />
is a basic input parameter to the functions of the emission modelling tool.<br />
energy and electricity mix <strong>for</strong> railways<br />
This paragraph explains the energetic mix. It represents a fundamental parameter when estimating<br />
emissions of rail <strong>freight</strong> transport, its sources from which is generated the electricity suitable<br />
to implement the rail transport. It is a relevant factor to correctly estimate the emissions from<br />
rail transport, due to its difference of pollution emissions, according the sources of energy.<br />
The analysis of fleet framework in the <strong>Alpine</strong><br />
network considered the composition of the<br />
overall trucks circulating <strong>for</strong> business purposes<br />
within the alpine territory per vehicle emission<br />
standard: euro 0, euro 1, euro 2, euro 3,<br />
Euro 4 ed Euro 5, as showed in the following<br />
figure.<br />
Euro 5<br />
41,6%<br />
Selected sources to estimate the framework<br />
of fleet was the ufT - Federal office of transport<br />
(FOT) Confederation Suisse - alpinfo data<br />
(2009), verified on the basis of outcomes of the<br />
<strong>Alpine</strong> <strong>Space</strong> Programme project AlpCheck.<br />
Euro 2<br />
3,4%<br />
Euro 3<br />
38,8%<br />
The term energy mix is used to define the<br />
combination of the sources used to achieve<br />
the goal of supply provided. The amount of<br />
energy consumed in a given period is defined,<br />
<strong>for</strong> industrialized Countries, as primary energy.<br />
In order to reach the share of primary energy<br />
required <strong>for</strong> domestic needs, diverse sources<br />
of energy are used such as electricity, heat, renewable<br />
sources etc.<br />
The availability of a country’s primary energy<br />
is guaranteed through their production<br />
on National soil and through trade agreements<br />
(buy or exchange). Regarding the production<br />
of electricity at a European scale, a significant<br />
rate is given by nuclear power (approximately<br />
17%).<br />
In particular, the share of consumption from<br />
renewable sources in Europe amounts to about<br />
8%, while 13% is provided by nuclear energy.<br />
Among <strong>Alpine</strong> countries, Austria has the largest<br />
share of renewable sources (66%), followed by<br />
Switzerland (55%), which also registers a high<br />
share of nuclear power (41%).<br />
Regarding energy mix on the current consumption<br />
of electricity <strong>for</strong> UE railways, the main<br />
benchmark is the UIC (Union Railways International),<br />
in the report “Rail Transport and Environment<br />
- Facts & Figures” - 2008.<br />
The specific rail electricity mix <strong>for</strong> alpine<br />
countries (Austria, Italy, Germany, Switzerland),<br />
is shown in the figure below of, as a<br />
source SBB.<br />
Euro 4<br />
16,2%<br />
Euro 2<br />
Euro 3<br />
Euro 4<br />
Euro 5<br />
Composition of the overall circulating <strong>freight</strong> vehicles per Euro category.<br />
Source: own elaboration on Alpinfo data (2009)<br />
It is assumed to use a macro-classification, composed by Euro 2-3 and Euro 4-5 vehicles.<br />
This assumption is based on:<br />
• the sharing of truck fleet, according the Euro classes;<br />
• the emission factors per each vehicle category;<br />
• the estimation of emissions per single TEU.<br />
100%<br />
80%<br />
60%<br />
40%<br />
20%<br />
0%<br />
Austria<br />
Germany<br />
Swizterland<br />
Austria<br />
Germany<br />
Italy<br />
Austria<br />
Germany<br />
Italy<br />
hydropower natural gas coal<br />
Austria 85% 8% 7%<br />
Railways Electricity Mix<br />
Germany<br />
Swizterland<br />
nuclear<br />
power<br />
Germany 10% 9% 54% 27%<br />
Italy 42% 12% 36% 10%<br />
Swizterland 75% 25%<br />
Railways electricity mix.<br />
Source: own elaboration based on SBB data<br />
Italy<br />
water & wind<br />
power<br />
Italy<br />
oil<br />
96 transitects – final report<br />
CalCulating the environmental effeCts of pilot ConneCtions<br />
97