Download - Odeon
Download - Odeon
Download - Odeon

You also want an ePaper? Increase the reach of your titles
YUMPU automatically turns print PDFs into web optimized ePapers that Google loves.
inary and have the extension .SO8. An example on a directivity pattern is the pattern stored in<br />
OMNI.SO8.<br />
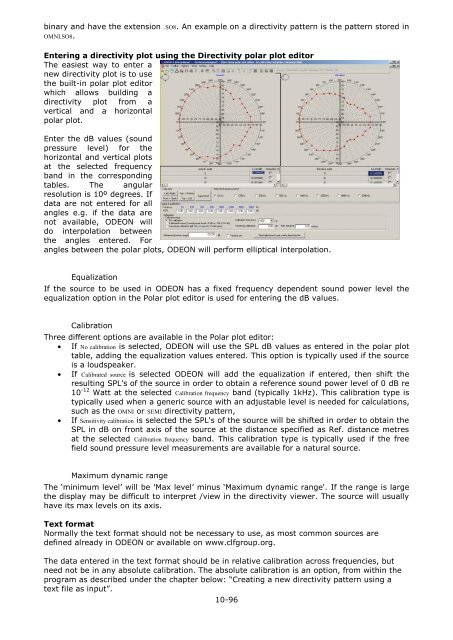
Entering a directivity plot using the Directivity polar plot editor<br />
The easiest way to enter a<br />
new directivity plot is to use<br />
the built-in polar plot editor<br />
which allows building a<br />
directivity plot from a<br />
vertical and a horizontal<br />
polar plot.<br />
Enter the dB values (sound<br />
pressure level) for the<br />
horizontal and vertical plots<br />
at the selected frequency<br />
band in the corresponding<br />
tables. The angular<br />
resolution is 10º degrees. If<br />
data are not entered for all<br />
angles e.g. if the data are<br />
not available, ODEON will<br />
do interpolation between<br />
the angles entered. For<br />
angles between the polar plots, ODEON will perform elliptical interpolation.<br />
Equalization<br />
If the source to be used in ODEON has a fixed frequency dependent sound power level the<br />
equalization option in the Polar plot editor is used for entering the dB values.<br />
Calibration<br />
Three different options are available in the Polar plot editor:<br />
If No calibration is selected, ODEON will use the SPL dB values as entered in the polar plot<br />
table, adding the equalization values entered. This option is typically used if the source<br />
is a loudspeaker.<br />
If Calibrated source is selected ODEON will add the equalization if entered, then shift the<br />
resulting SPL's of the source in order to obtain a reference sound power level of 0 dB re<br />
10 -12 Watt at the selected Calibration frequency band (typically 1kHz). This calibration type is<br />
typically used when a generic source with an adjustable level is needed for calculations,<br />
such as the OMNI or SEMI directivity pattern,<br />
If Sensitivity calibration is selected the SPL's of the source will be shifted in order to obtain the<br />
SPL in dB on front axis of the source at the distance specified as Ref. distance metres<br />
at the selected Calibration frequency band. This calibration type is typically used if the free<br />
field sound pressure level measurements are available for a natural source.<br />
Maximum dynamic range<br />
The ‘minimum level’ will be 'Max level’ minus ‘Maximum dynamic range'. If the range is large<br />
the display may be difficult to interpret /view in the directivity viewer. The source will usually<br />
have its max levels on its axis.<br />
Text format<br />
Normally the text format should not be necessary to use, as most common sources are<br />
defined already in ODEON or available on www.clfgroup.org.<br />
The data entered in the text format should be in relative calibration across frequencies, but<br />
need not be in any absolute calibration. The absolute calibration is an option, from within the<br />
program as described under the chapter below: “Creating a new directivity pattern using a<br />
text file as input”.<br />
10-96