OKC Plan, 2000-2020 - City of Oklahoma City
OKC Plan, 2000-2020 - City of Oklahoma City
OKC Plan, 2000-2020 - City of Oklahoma City

You also want an ePaper? Increase the reach of your titles
YUMPU automatically turns print PDFs into web optimized ePapers that Google loves.
Current Situation<br />
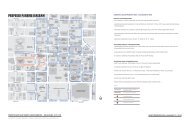
The map on page 108 shows the location <strong>of</strong> new housing construction in the <strong>Oklahoma</strong> <strong>City</strong><br />
region during the period 1990-1997. The North/Northwest <strong>OKC</strong>-Edmond area has experienced<br />
the highest concentration <strong>of</strong> new housing over this period. A second concentration has occurred<br />
in the South <strong>OKC</strong>-Moore- Norman area. <strong>Oklahoma</strong> <strong>City</strong>’s share <strong>of</strong> all new hosing construction<br />
in the region has increased from 46 percent in 1990 to 55 percent in 1997. This increase has<br />
corresponded with a resurgence in multi-family construction and is due in large part to<br />
<strong>Oklahoma</strong> <strong>City</strong>’s predominant share (70-80 percent) <strong>of</strong> multi-family construction.<br />
<strong>Oklahoma</strong> <strong>City</strong>’s share <strong>of</strong> metro employment has declined from 70 percent in 1990 to 68 percent<br />
in 1995.<br />
<strong>Oklahoma</strong> <strong>City</strong><br />
Employment<br />
Metro Total<br />
1990 302,800 430,600<br />
1995 325,900 476,500<br />
Sources:<br />
US Bureau <strong>of</strong> Labor Statistics for Metro Totals;<br />
Association <strong>of</strong> Central <strong>Oklahoma</strong> Governments<br />
for <strong>Oklahoma</strong> <strong>City</strong> employment<br />
<strong>Oklahoma</strong> <strong>City</strong> is the major center for retail sales in the region, although its position in the<br />
region has declined somewhat in recent years as shown in the graphs below. In 1990, the <strong>City</strong><br />
had 62 percent <strong>of</strong> metro area sales subject to sales tax. Also in 1990, <strong>City</strong> businesses generated<br />
$10,160 in sales per capita, which was 1.92 times the $5,328 per capita generated in all other<br />
metro cities. By 1997, the <strong>City</strong>’s share <strong>of</strong> metro sales had declined to just under 60 percent and<br />
the <strong>City</strong>’s per capita <strong>of</strong> $12,525 had fallen to 1.77 times the $7,095 per capita for other cities.<br />
SALES SUBJECT TO SALES TAX<br />
SALES PER CAPITA<br />
Sources:<br />
ORIGINS, <strong>Oklahoma</strong> Department <strong>of</strong> Commerce and<br />
Center <strong>of</strong> Economic and Management Research, <strong>Oklahoma</strong> University<br />
Cooperative intergovernmental arrangements started years ago with the Association <strong>of</strong> Central<br />
<strong>Oklahoma</strong> Governments (ACOG), other communities, fire departments, and <strong>Oklahoma</strong> County<br />
and yet sprawl, competition, and political fragmentation endure.<br />
105