TABLE OF CONTENT - Emfuleni Local Municipality
TABLE OF CONTENT - Emfuleni Local Municipality
TABLE OF CONTENT - Emfuleni Local Municipality

Create successful ePaper yourself
Turn your PDF publications into a flip-book with our unique Google optimized e-Paper software.
4.1.3.6 Economic Performance<br />
Table 4.2 GGP and Growth Rates<br />
Area 2006 (constant 2000 prices) Growth Rate (%)<br />
<strong>Emfuleni</strong> <strong>Local</strong> Rand Value (R’m) % contribution 1995-2000 2000-2006<br />
<strong>Municipality</strong> 12 784 77.0% 0.4% 1.8%<br />
Source: Urban-Eco calculations based on Quantec data, 2006<br />
Economic Growth of the municipality had been at a lower pace as compared to the<br />
targets set by the Gauteng Growth and Development Strategy for the district.<br />
Table 4.3 Projected GGP and Growth Rates<br />
Area 2006 (constant 2000 prices) Growth Rate (%)<br />
<strong>Emfuleni</strong> <strong>Local</strong> Rand Value Rand Value 2006-2011 2011-2016<br />
<strong>Municipality</strong> (R’m) 2011 (R’m) 2016<br />
12 784 77.0% 1.1% 1.1%<br />
Source: Urban-Eco calculations based on Quantec data, 2006<br />
It is important to note that economic trends presented above do not accommodate any<br />
unpredictable scenarios. It is based on historical realistic economic trends of the<br />
municipality. The economy of <strong>Emfuleni</strong> is predicted by Urban-Econ to be stagnant for the<br />
next ten years and more.<br />
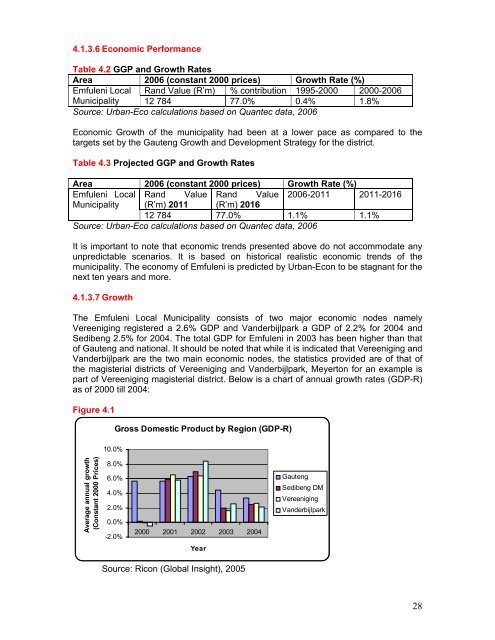
4.1.3.7 Growth<br />
The <strong>Emfuleni</strong> <strong>Local</strong> <strong>Municipality</strong> consists of two major economic nodes namely<br />
Vereeniging registered a 2.6% GDP and Vanderbijlpark a GDP of 2.2% for 2004 and<br />
Sedibeng 2.5% for 2004. The total GDP for <strong>Emfuleni</strong> in 2003 has been higher than that<br />
of Gauteng and national. It should be noted that while it is indicated that Vereeniging and<br />
Vanderbijlpark are the two main economic nodes, the statistics provided are of that of<br />
the magisterial districts of Vereeniging and Vanderbijlpark, Meyerton for an example is<br />
part of Vereeniging magisterial district. Below is a chart of annual growth rates (GDP-R)<br />
as of 2000 till 2004:<br />
Figure 4.1<br />
Average annual growth<br />
(Constant 2000 Prices)<br />
10.0%<br />
-2.0%<br />
Gross Domestic Product by Region (GDP-R)<br />
8.0%<br />
6.0%<br />
4.0%<br />
2.0%<br />
0.0%<br />
2000 2001 2002 2003 2004<br />
Year<br />
Source: Ricon (Global Insight), 2005<br />
Gauteng<br />
Sedibeng DM<br />
Vereeniging<br />
Vanderbijlpark<br />
28