Jamaica: Macro-Socio-Economic and Environmental Assessment of ...
Jamaica: Macro-Socio-Economic and Environmental Assessment of ...
Jamaica: Macro-Socio-Economic and Environmental Assessment of ...

You also want an ePaper? Increase the reach of your titles
YUMPU automatically turns print PDFs into web optimized ePapers that Google loves.
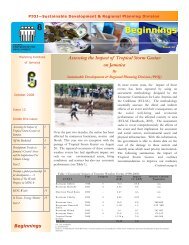
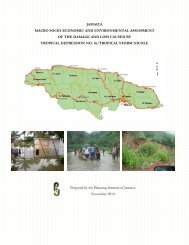
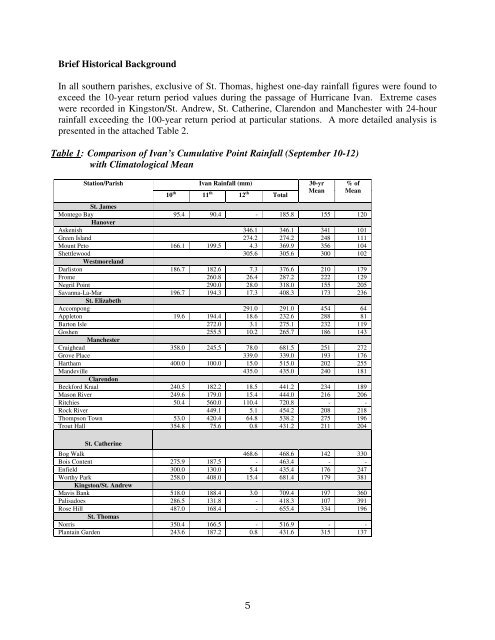
Brief Historical Background<br />
In all southern parishes, exclusive <strong>of</strong> St. Thomas, highest one-day rainfall figures were found to<br />
exceed the 10-year return period values during the passage <strong>of</strong> Hurricane Ivan. Extreme cases<br />
were recorded in Kingston/St. Andrew, St. Catherine, Clarendon <strong>and</strong> Manchester with 24-hour<br />
rainfall exceeding the 100-year return period at particular stations. A more detailed analysis is<br />
presented in the attached Table 2.<br />
Table 1: Comparison <strong>of</strong> Ivan’s Cumulative Point Rainfall (September 10-12)<br />
with Climatological Mean<br />
Station/Parish<br />
Ivan Rainfall (mm)<br />
10 th 11 th 12 th Total<br />
30-yr<br />
Mean<br />
% <strong>of</strong><br />
Mean<br />
St. James<br />
Montego Bay 95.4 90.4 - 185.8 155 120<br />
Hanover<br />
Askenish 346.1 346.1 341 101<br />
Green Isl<strong>and</strong> 274.2 274.2 248 111<br />
Mount Peto 166.1 199.5 4.3 369.9 356 104<br />
Shettlewood 305.6 305.6 300 102<br />
Westmorel<strong>and</strong><br />
Darliston 186.7 182.6 7.3 376.6 210 179<br />
Frome 260.8 26.4 287.2 222 129<br />
Negril Point 290.0 28.0 318.0 155 205<br />
Savanna-La-Mar 196.7 194.3 17.3 408.3 173 236<br />
St. Elizabeth<br />
Accompong 291.0 291.0 454 64<br />
Appleton 19.6 194.4 18.6 232.6 288 81<br />
Barton Isle 272.0 3.1 275.1 232 119<br />
Goshen 255.5 10.2 265.7 186 143<br />
Manchester<br />
Craighead 358.0 245.5 78.0 681.5 251 272<br />
Grove Place 339.0 339.0 193 176<br />
Hartham 400.0 100.0 15.0 515.0 202 255<br />
M<strong>and</strong>eville 435.0 435.0 240 181<br />
Clarendon<br />
Beckford Kraal 240.5 182.2 18.5 441.2 234 189<br />
Mason River 249.6 179.0 15.4 444.0 216 206<br />
Ritchies 50.4 560.0 110.4 720.8 - -<br />
Rock River 449.1 5.1 454.2 208 218<br />
Thompson Town 53.0 420.4 64.8 538.2 275 196<br />
Trout Hall 354.8 75.6 0.8 431.2 211 204<br />
St. Catherine<br />
Bog Walk 468.6 468.6 142 330<br />
Bois Content 275.9 187.5 - 463.4 - -<br />
Enfield 300.0 130.0 5.4 435.4 176 247<br />
Worthy Park 258.0 408.0 15.4 681.4 179 381<br />
Kingston/St. Andrew<br />
Mavis Bank 518.0 188.4 3.0 709.4 197 360<br />
Palisadoes 286.5 131.8 - 418.3 107 391<br />
Rose Hill 487.0 168.4 - 655.4 334 196<br />
St. Thomas<br />
Norris 350.4 166.5 - 516.9 - -<br />
Plantain Garden 243.6 187.2 0.8 431.6 315 137<br />
5