Jamaica: Macro-Socio-Economic and Environmental Assessment of ...
Jamaica: Macro-Socio-Economic and Environmental Assessment of ...
Jamaica: Macro-Socio-Economic and Environmental Assessment of ...

Create successful ePaper yourself
Turn your PDF publications into a flip-book with our unique Google optimized e-Paper software.
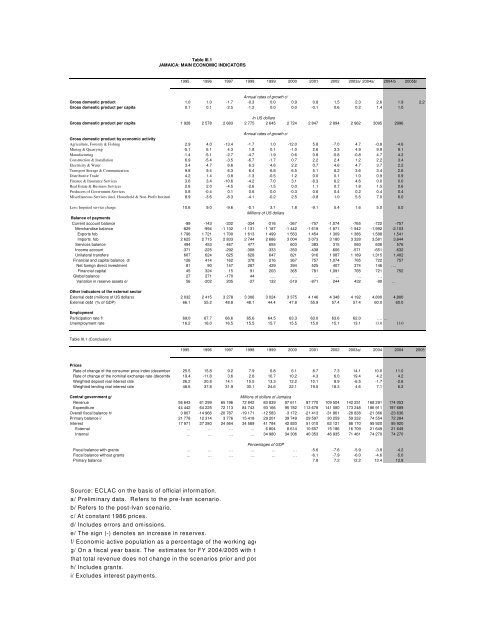
Table III.1<br />
JAMAICA: MAIN ECONOMIC INDICATORS<br />
1995 1996 1997 1998 1999 2000 2001 2002 2003a/ 2004a/ 2004/b 2005b/<br />
Annual rates <strong>of</strong> growth c/<br />
Gross domestic product 1.0 1.0 -1.7 -0.3 0.0 0.9 0.8 1.5 2.3 2.6 1.9 2.2<br />
Gross domestic product per capita 0.1 0.1 -2.5 -1.2 0.0 0.0 -0.1 0.6 0.2 1.4 1.0<br />
In US dollars<br />
Gross domestic product per capita 1 928 2 578 2 683 2 775 2 645 2 724 2 847 2 894 2 962 3095 2996<br />
Annual rates <strong>of</strong> growth c/<br />
Gross domestic product by economic activity<br />
Agriculture, Forestry & Fishing 2.9 4.0 -13.4 -1.7 1.0 -12.0 5.8 -7.0 4.7 -0.8 -4.6<br />
Mining & Quarrying -5.1 6.1 4.3 1.8 0.1 -1.0 2.6 3.3 4.9 9.9 9.1<br />
Manufacturing -1.4 -5.1 -2.7 -4.7 -1.9 0.6 0.8 -0.8 -0.8 4.7 4.2<br />
Construction & Installation 6.9 -5.4 -3.5 -6.7 -1.7 0.7 2.2 2.4 1.2 2.2 3.4<br />
Electricity & Water 3.4 4.7 6.6 6.3 4.6 2.2 0.7 4.6 4.7 3.7 2.2<br />
Transport Storage & Communication 9.8 9.4 6.3 6.4 6.8 6.5 5.1 6.2 3.6 3.4 2.6<br />
Distributive Trade 4.2 1.4 0.8 -1.3 -0.5 1.2 0.0 0.1 1.0 0.9 0.9<br />
Finance & Insurance Services 3.6 3.4 -10.6 -4.2 7.0 3.1 -8.3 6.2 4.6 0.0 0.0<br />
Real Estate & Business Services 2.8 2.0 -4.5 -2.6 -1.5 0.0 1.1 0.7 1.8 1.5 0.6<br />
Producers <strong>of</strong> Government Services 0.8 -0.4 0.1 0.6 0.0 -0.3 0.6 0.4 0.2 0.4 0.4<br />
Miscellaneous Services (incl. Household & Non-Pr<strong>of</strong>it Institutions) 8.9 -3.6 -8.3 -4.1 -0.2 2.5 -0.8 1.0 5.5 7.0 6.0<br />
Less: Imputed service charge 10.6 9.0 -9.6 -0.1 3.1 1.8 -9.1 5.4 1.6 5.0 5.0<br />
Millions <strong>of</strong> US dollars<br />
Balance <strong>of</strong> payments<br />
Current account balance -99 -143 -332 -334 -216 -367 -757 -1,074 -765 -722 -757<br />
Merch<strong>and</strong>ise balance -829 -994 -1 132 -1 131 -1 187 -1 442 -1 618 -1 871 -1 942 -1,992 -2,103<br />
Exports fob 1 796 1 721 1 700 1 613 1 499 1 563 1 454 1 309 1 386 1,588 1,541<br />
Imports fob 2 625 2 715 2 833 2 744 2 686 3 004 3 073 3 180 3 328 3,581 3,644<br />
Services balance 494 453 467 477 655 603 383 315 560 606 576<br />
Income account -371 -225 -292 -308 -333 -350 -438 -606 -571 -651 -632<br />
Unilateral transfers 607 624 625 628 647 821 916 1 087 1 189 1,315 1,402<br />
Financial <strong>and</strong> capital balance d/ 126 414 162 378 216 367 757 1,074 765 722 757<br />
Net foreign direct investment 81 90 147 287 429 394 525 407 374 146 ….<br />
Financial capital 45 324 15 91 203 365 781 1,091 765 721 752<br />
Global balance 27 271 -170 44 ….. …. … … ... …<br />
Variation in reserve assets e/ 56 -202 205 -27 132 -519 -871 244 432 -90 …<br />
Other indicators <strong>of</strong> the external sector<br />
External debt (millions <strong>of</strong> US dollars) 2 032 2 415 3 278 3 306 3 024 3 375 4 146 4 348 4 192 4,800 4,800<br />
External debt (% <strong>of</strong> GDP) 66.1 55.2 48.8 48.1 44.4 47.8 55.9 57.4 57.4 60.0 60.0<br />
Employment<br />
Participation rate f/ 69.0 67.7 66.6 65.6 64.5 63.3 63.0 63.6 62.0 …. …<br />
Unemployment rate 16.2 16.0 16.5 15.5 15.7 15.5 15.0 15.1 13.1 13.0 13.0<br />
Table III.1 (Conclusion)<br />
1995 1996 1997 1998 1999 2000 2001 2002 2003a/ 2004 2004 2005<br />
Prices<br />
Rate <strong>of</strong> change <strong>of</strong> the consumer price index (december to december) 25.5 15.8 9.2 7.9 6.8 6.1 8.7 7.3 14.1 10.0 11.0<br />
Rate <strong>of</strong> change <strong>of</strong> the nominal exchange rate (december to december) 19.4 -11.8 3.6 2.6 10.7 10.2 4.3 6.0 19.4 4.2 4.2<br />
Weighted deposit real interest rate 26.2 20.8 14.1 15.5 13.3 12.2 10.1 8.9 -6.5 -1.7 -2.6<br />
Weighted lending real interest rate 48.6 37.8 31.9 30.1 24.6 22.1 19.5 18.3 4.6 7.1 6.2<br />
Central government g/<br />
Millions <strong>of</strong> dollars <strong>of</strong> <strong>Jamaica</strong><br />
Revenue 56 643 61 299 65 196 72 842 83 839 97 611 97 770 109 504 142 251 168 291 174 053<br />
Expenditure 44 442 64 225 72 113 84 743 93 166 95 782 113 678 141 080 173 248 186 911 197 689<br />
Overall fiscal balance h/ 3 807 -14 966 -20 787 -19 171 -12 583 -3 172 -21 413 -31 861 -28 838 -21 366 -23 636<br />
Primary balance i/ 21 778 12 314 3 776 15 418 29 201 39 749 29 597 30 259 59 332 74 554 72 284<br />
Interest 17 971 27 280 24 564 34 589 41 784 42 920 51 010 62 121 88 170 95 920 95 920<br />
External … … … … 6 804 8 614 10 657 15 186 16 709 21 649 21 649<br />
Internal … … … … 34 980 34 306 40 353 46 935 71 461 74 270 74 270<br />
Percentages <strong>of</strong> GDP<br />
Fiscal balance with grants … … … … … … -5.6 -7.6 -5.9 -3.8 -4.2<br />
Fiscal balance without grants … … … … … … -6.1 -7.9 -6.0 -4.6 -5.0<br />
Primary balance 7.8 7.2 12.2 13.4 12.8<br />
Source: ECLAC on the basis <strong>of</strong> <strong>of</strong>ficial information.<br />
a/ Preliminary data. Refers to the pre-Ivan scenario.<br />
b/ Refers to the post-Ivan scenario.<br />
c/ At constant 1986 prices.<br />
d/ Includes errors <strong>and</strong> omissions.<br />
e/ The sign (-) denotes an increase in reserves.<br />
f/ <strong>Economic</strong> active population as a percentage <strong>of</strong> the working age population.<br />
g/ On a fiscal year basis. The estimates for FY 2004/2005 with the disaster are based on the assumption that the governnment assumes 30% on th<br />
that total revenue does not change in the scenarios prior <strong>and</strong> post Ivan.<br />
h/ Includes grants.<br />
i/ Excludes interest payments.