Option-Implied Currency Risk Premia - Princeton University
Option-Implied Currency Risk Premia - Princeton University
Option-Implied Currency Risk Premia - Princeton University

You also want an ePaper? Increase the reach of your titles
YUMPU automatically turns print PDFs into web optimized ePapers that Google loves.
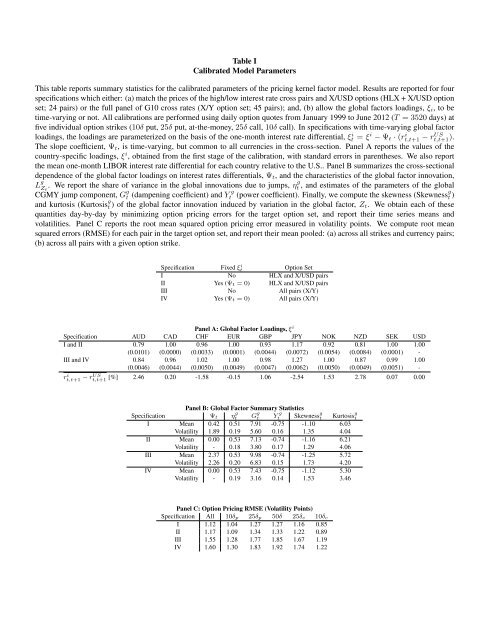
Table I<br />
Calibrated Model Parameters<br />
This table reports summary statistics for the calibrated parameters of the pricing kernel factor model. Results are reported for four<br />
specifications which either: (a) match the prices of the high/low interest rate cross pairs and X/USD options (HLX + X/USD option<br />
set; 24 pairs) or the full panel of G10 cross rates (X/Y option set; 45 pairs); and, (b) allow the global factors loadings, ξ i , to be<br />
time-varying or not. All calibrations are performed using daily option quotes from January 1999 to June 2012 (T = 3520 days) at<br />
five individual option strikes (10δ put, 25δ put, at-the-money, 25δ call, 10δ call). In specifications with time-varying global factor<br />
loadings, the loadings are parameterized on the basis of the one-month interest rate differential, ξt i = ξ i − Ψ t · (rt,t+1 i − rt,t+1).<br />
US<br />
The slope coefficient, Ψ t , is time-varying, but common to all currencies in the cross-section. Panel A reports the values of the<br />
country-specific loadings, ξ i , obtained from the first stage of the calibration, with standard errors in parentheses. We also report<br />
the mean one-month LIBOR interest rate differential for each country relative to the U.S.. Panel B summarizes the cross-sectional<br />
dependence of the global factor loadings on interest rates differentials, Ψ t , and the characteristics of the global factor innovation,<br />
L g Z t<br />
. We report the share of variance in the global innovations due to jumps, η g t , and estimates of the parameters of the global<br />
CGMY jump component, G g t (dampening coefficient) and Y g<br />
t (power coefficient). Finally, we compute the skewness (Skewness g t )<br />
and kurtosis (Kurtosis g t ) of the global factor innovation induced by variation in the global factor, Z t . We obtain each of these<br />
quantities day-by-day by minimizing option pricing errors for the target option set, and report their time series means and<br />
volatilities. Panel C reports the root mean squared option pricing error measured in volatility points. We compute root mean<br />
squared errors (RMSE) for each pair in the target option set, and report their mean pooled: (a) across all strikes and currency pairs;<br />
(b) across all pairs with a given option strike.<br />
Specification Fixed ξt i <strong>Option</strong> Set<br />
I No HLX and X/USD pairs<br />
II Yes (Ψ t = 0) HLX and X/USD pairs<br />
III No All pairs (X/Y)<br />
IV Yes (Ψ t = 0) All pairs (X/Y)<br />
Panel A: Global Factor Loadings, ξ i<br />
Specification AUD CAD CHF EUR GBP JPY NOK NZD SEK USD<br />
I and II 0.79 1.00 0.96 1.00 0.93 1.17 0.92 0.81 1.00 1.00<br />
(0.0101) (0.0000) (0.0033) (0.0001) (0.0044) (0.0072) (0.0054) (0.0084) (0.0001) -<br />
III and IV 0.84 0.96 1.02 1.00 0.98 1.27 1.00 0.87 0.99 1.00<br />
(0.0046) (0.0044) (0.0050) (0.0049) (0.0047) (0.0062) (0.0050) (0.0049) (0.0051) -<br />
rt,t+1 i − rUS t,t+1 [%] 2.46 0.20 -1.58 -0.15 1.06 -2.54 1.53 2.78 0.07 0.00<br />
Panel B: Global Factor Summary Statistics<br />
Specification Ψ t η g t G g t Y g<br />
t Skewness g t Kurtosis g t<br />
I Mean 0.42 0.51 7.91 -0.75 -1.10 6.03<br />
Volatility 1.89 0.19 5.60 0.16 1.35 4.04<br />
II Mean 0.00 0.53 7.13 -0.74 -1.16 6.21<br />
Volatility - 0.18 3.80 0.17 1.29 4.06<br />
III Mean 2.37 0.53 9.98 -0.74 -1.25 5.72<br />
Volatility 2.26 0.20 6.83 0.15 1.73 4.20<br />
IV Mean 0.00 0.53 7.43 -0.75 -1.12 5.30<br />
Volatility - 0.19 3.16 0.14 1.53 3.46<br />
Panel C: <strong>Option</strong> Pricing RMSE (Volatility Points)<br />
Specification All 10δ p 25δ p 50δ 25δ c 10δ c<br />
I 1.12 1.04 1.27 1.27 1.16 0.85<br />
II 1.17 1.09 1.34 1.33 1.22 0.89<br />
III 1.55 1.28 1.77 1.85 1.67 1.19<br />
IV 1.60 1.30 1.83 1.92 1.74 1.22