Option-Implied Currency Risk Premia - Princeton University
Option-Implied Currency Risk Premia - Princeton University
Option-Implied Currency Risk Premia - Princeton University

You also want an ePaper? Increase the reach of your titles
YUMPU automatically turns print PDFs into web optimized ePapers that Google loves.
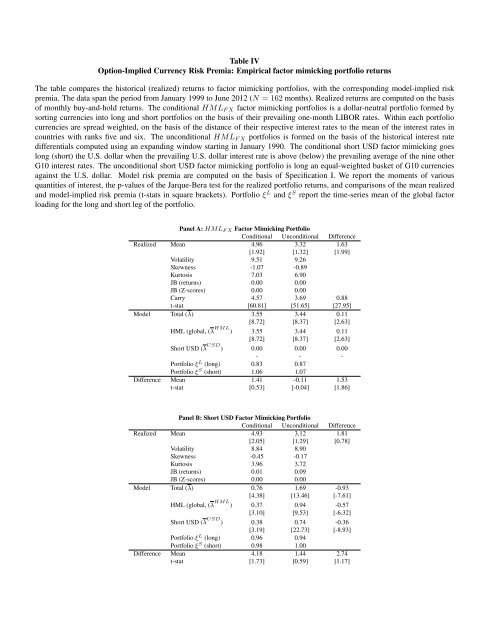
Table IV<br />
<strong>Option</strong>-<strong>Implied</strong> <strong>Currency</strong> <strong>Risk</strong> <strong>Premia</strong>: Empirical factor mimicking portfolio returns<br />
The table compares the historical (realized) returns to factor mimicking portfolios, with the corresponding model-implied risk<br />
premia. The data span the period from January 1999 to June 2012 (N = 162 months). Realized returns are computed on the basis<br />
of monthly buy-and-hold returns. The conditional HML F X factor mimicking portfolios is a dollar-neutral portfolio formed by<br />
sorting currencies into long and short portfolios on the basis of their prevailing one-month LIBOR rates. Within each portfolio<br />
currencies are spread weighted, on the basis of the distance of their respective interest rates to the mean of the interest rates in<br />
countries with ranks five and six. The unconditional HML F X portfolios is formed on the basis of the historical interest rate<br />
differentials computed using an expanding window starting in January 1990. The conditional short USD factor mimicking goes<br />
long (short) the U.S. dollar when the prevailing U.S. dollar interest rate is above (below) the prevailing average of the nine other<br />
G10 interest rates. The unconditional short USD factor mimicking portfolio is long an equal-weighted basket of G10 currencies<br />
against the U.S. dollar. Model risk premia are computed on the basis of Specification I. We report the moments of various<br />
quantities of interest, the p-values of the Jarque-Bera test for the realized portfolio returns, and comparisons of the mean realized<br />
and model-implied risk premia (t-stats in square brackets). Portfolio ξ L and ξ S report the time-series mean of the global factor<br />
loading for the long and short leg of the portfolio.<br />
Panel A: HML F X Factor Mimicking Portfolio<br />
Conditional Unconditional Difference<br />
Realized Mean 4.96 3.32 1.63<br />
[1.92] [1.32] [1.99]<br />
Volatility 9.51 9.26<br />
Skewness -1.07 -0.89<br />
Kurtosis 7.03 6.90<br />
JB (returns) 0.00 0.00<br />
JB (Z-scores) 0.00 0.00<br />
Carry 4.57 3.69 0.88<br />
t-stat [60.81] [51.65] [27.95]<br />
Model Total (λ) 3.55 3.44 0.11<br />
[8.72] [8.37] [2.63]<br />
HML (global, (λ HML ) 3.55 3.44 0.11<br />
[8.72] [8.37] [2.63]<br />
Short USD (λ USD ) 0.00 0.00 0.00<br />
- - -<br />
Portfolio ξ L (long) 0.83 0.87<br />
Portfolio ξ S (short) 1.06 1.07<br />
Difference Mean 1.41 -0.11 1.53<br />
t-stat [0.53] [-0.04] [1.86]<br />
Panel B: Short USD Factor Mimicking Portfolio<br />
Conditional Unconditional Difference<br />
Realized Mean 4.93 3.12 1.81<br />
[2.05] [1.29] [0.78]<br />
Volatility 8.84 8.90<br />
Skewness -0.45 -0.17<br />
Kurtosis 3.96 3.72<br />
JB (returns) 0.01 0.09<br />
JB (Z-scores) 0.00 0.00<br />
Model Total (λ) 0.76 1.69 -0.93<br />
[4.38] [13.46] [-7.61]<br />
HML (global, (λ HML ) 0.37 0.94 -0.57<br />
[3.10] [9.53] [-6.32]<br />
Short USD (λ USD ) 0.38 0.74 -0.36<br />
[3.19] [22.73] [-8.93]<br />
Portfolio ξ L (long) 0.96 0.94<br />
Portfolio ξ S (short) 0.98 1.00<br />
Difference Mean 4.18 1.44 2.74<br />
t-stat [1.73] [0.59] [1.17]