Option-Implied Currency Risk Premia - Princeton University
Option-Implied Currency Risk Premia - Princeton University
Option-Implied Currency Risk Premia - Princeton University

You also want an ePaper? Increase the reach of your titles
YUMPU automatically turns print PDFs into web optimized ePapers that Google loves.
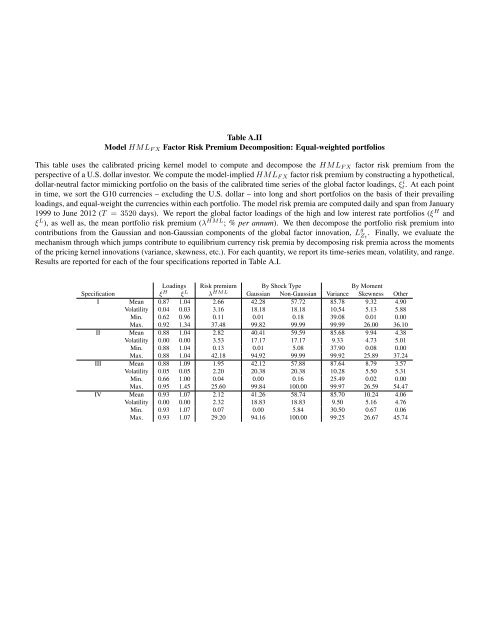
Table A.II<br />
Model HML F X Factor <strong>Risk</strong> Premium Decomposition: Equal-weighted portfolios<br />
This table uses the calibrated pricing kernel model to compute and decompose the HML F X factor risk premium from the<br />
perspective of a U.S. dollar investor. We compute the model-implied HML F X factor risk premium by constructing a hypothetical,<br />
dollar-neutral factor mimicking portfolio on the basis of the calibrated time series of the global factor loadings, ξ i t. At each point<br />
in time, we sort the G10 currencies – excluding the U.S. dollar – into long and short portfolios on the basis of their prevailing<br />
loadings, and equal-weight the currencies within each portfolio. The model risk premia are computed daily and span from January<br />
1999 to June 2012 (T = 3520 days). We report the global factor loadings of the high and low interest rate portfolios (ξ H and<br />
ξ L ), as well as, the mean portfolio risk premium (λ HML ; % per annum). We then decompose the portfolio risk premium into<br />
contributions from the Gaussian and non-Gaussian components of the global factor innovation, L g Z t<br />
. Finally, we evaluate the<br />
mechanism through which jumps contribute to equilibrium currency risk premia by decomposing risk premia across the moments<br />
of the pricing kernel innovations (variance, skewness, etc.). For each quantity, we report its time-series mean, volatility, and range.<br />
Results are reported for each of the four specifications reported in Table A.I.<br />
Loadings <strong>Risk</strong> premium By Shock Type By Moment<br />
Specification ξ H ξ L λ HML Gaussian Non-Gaussian Variance Skewness Other<br />
I Mean 0.87 1.04 2.66 42.28 57.72 85.78 9.32 4.90<br />
Volatility 0.04 0.03 3.16 18.18 18.18 10.54 5.13 5.88<br />
Min. 0.62 0.96 0.11 0.01 0.18 39.08 0.01 0.00<br />
Max. 0.92 1.34 37.48 99.82 99.99 99.99 26.00 36.10<br />
II Mean 0.88 1.04 2.82 40.41 59.59 85.68 9.94 4.38<br />
Volatility 0.00 0.00 3.53 17.17 17.17 9.33 4.73 5.01<br />
Min. 0.88 1.04 0.13 0.01 5.08 37.90 0.08 0.00<br />
Max. 0.88 1.04 42.18 94.92 99.99 99.92 25.89 37.24<br />
III Mean 0.88 1.09 1.95 42.12 57.88 87.64 8.79 3.57<br />
Volatility 0.05 0.05 2.20 20.38 20.38 10.28 5.50 5.31<br />
Min. 0.66 1.00 0.04 0.00 0.16 25.49 0.02 0.00<br />
Max. 0.95 1.45 25.60 99.84 100.00 99.97 26.59 54.47<br />
IV Mean 0.93 1.07 2.12 41.26 58.74 85.70 10.24 4.06<br />
Volatility 0.00 0.00 2.32 18.83 18.83 9.50 5.16 4.76<br />
Min. 0.93 1.07 0.07 0.00 5.84 30.50 0.67 0.06<br />
Max. 0.93 1.07 29.20 94.16 100.00 99.25 26.67 45.74