The Prudential Series Fund
The Prudential Series Fund
The Prudential Series Fund

You also want an ePaper? Increase the reach of your titles
YUMPU automatically turns print PDFs into web optimized ePapers that Google loves.
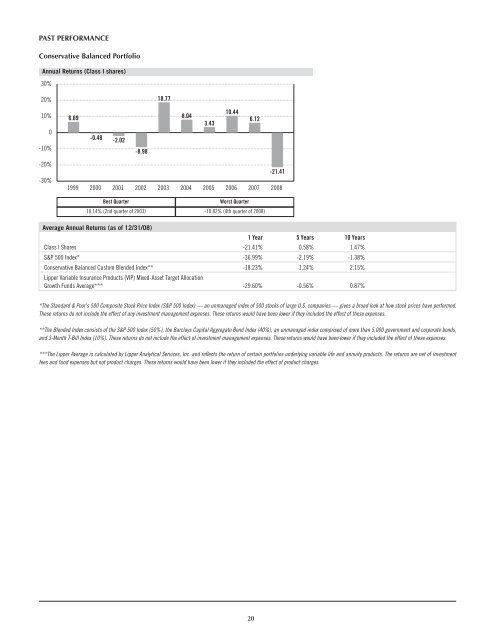
PAST PERFORMANCE<br />
Conservative Balanced Portfolio<br />
Annual Returns (Class I shares)<br />
30%<br />
20%<br />
18.77<br />
10%<br />
0<br />
-10%<br />
6.69<br />
-0.48<br />
-2.02<br />
-8.98<br />
8.04<br />
3.43<br />
10.44<br />
6.12<br />
-20%<br />
-30%<br />
1999<br />
2000<br />
2001<br />
2002<br />
2003<br />
2004<br />
2005<br />
2006<br />
2007<br />
-21.41<br />
2008<br />
Best Quarter<br />
Worst Quarter<br />
10.14% (2nd quarter of 2003) -10.82% (4th quarter of 2008)<br />
Average Annual Returns (as of 12/31/08)<br />
1 Year 5 Years 10 Years<br />
Class I Shares -21.41% 0.58% 1.47%<br />
S&P 500 Index* -36.99% -2.19% -1.38%<br />
Conservative Balanced Custom Blended Index** -18.23% 1.24% 2.15%<br />
Lipper Variable Insurance Products (VIP) Mixed-Asset Target Allocation<br />
Growth <strong>Fund</strong>s Average*** -29.60% -0.56% 0.87%<br />
*<strong>The</strong> Standard & Poor's 500 Composite Stock Price Index (S&P 500 Index) — an unmanaged index of 500 stocks of large U.S. companies — gives a broad look at how stock prices have performed.<br />
<strong>The</strong>se returns do not include the effect of any investment management expenses. <strong>The</strong>se returns would have been lower if they included the effect of these expenses.<br />
**<strong>The</strong> Blended Index consists of the S&P 500 Index (50%), the Barclays Capital Aggregate Bond Index (40%), an unmanaged index comprised of more than 5,000 government and corporate bonds,<br />
and 3-Month T-Bill Index (10%). <strong>The</strong>se returns do not include the effect of investment management expenses. <strong>The</strong>se returns would have been lower if they included the effect of these expenses.<br />
***<strong>The</strong> Lipper Average is calculated by Lipper Analytical Services, Inc. and reflects the return of certain portfolios underlying variable life and annuity products. <strong>The</strong> returns are net of investment<br />
fees and fund expenses but not product charges. <strong>The</strong>se returns would have been lower if they included the effect of product charges.<br />
20