The Prudential Series Fund
The Prudential Series Fund
The Prudential Series Fund

You also want an ePaper? Increase the reach of your titles
YUMPU automatically turns print PDFs into web optimized ePapers that Google loves.
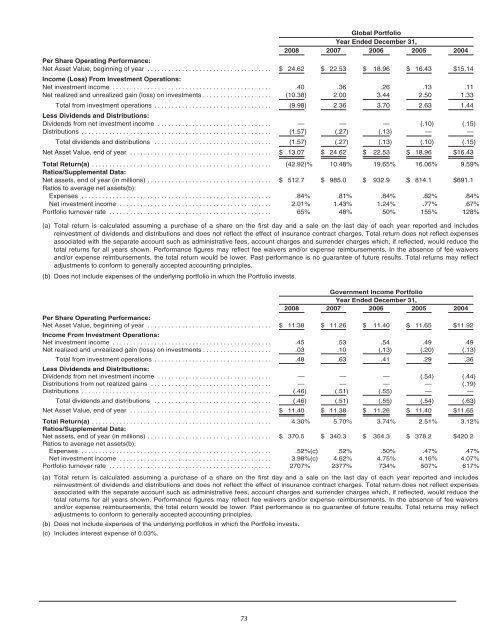
Global Portfolio<br />
Year Ended December 31,<br />
2008 2007 2006 2005 2004<br />
Per Share Operating Performance:<br />
Net Asset Value, beginning of year .................................... $ 24.62 $ 22.53 $ 18.96 $ 16.43 $15.14<br />
Income (Loss) From Investment Operations:<br />
Net investment income .............................................. .40 .36 .26 .13 .11<br />
Net realized and unrealized gain (loss) on investments .................... (10.38) 2.00 3.44 2.50 1.33<br />
Total from investment operations .................................. (9.98) 2.36 3.70 2.63 1.44<br />
Less Dividends and Distributions:<br />
Dividends from net investment income ................................. — — — (.10) (.15)<br />
Distributions ....................................................... (1.57) (.27) (.13) — —<br />
Total dividends and distributions .................................. (1.57) (.27) (.13) (.10) (.15)<br />
Net Asset Value, end of year ......................................... $ 13.07 $ 24.62 $ 22.53 $ 18.96 $16.43<br />
Total Return(a) .................................................... (42.92)% 10.48% 19.65% 16.06% 9.59%<br />
Ratios/Supplemental Data:<br />
Net assets, end of year (in millions) .................................... $ 512.7 $ 985.0 $ 932.9 $ 814.1 $691.1<br />
Ratios to average net assets(b):<br />
Expenses ....................................................... .84% .81% .84% .82% .84%<br />
Net investment income ............................................ 2.01% 1.43% 1.24% .77% .67%<br />
Portfolio turnover rate ............................................... 65% 48% 50% 155% 128%<br />
(a) Total return is calculated assuming a purchase of a share on the first day and a sale on the last day of each year reported and includes<br />
reinvestment of dividends and distributions and does not reflect the effect of insurance contract charges. Total return does not reflect expenses<br />
associated with the separate account such as administrative fees, account charges and surrender charges which, if reflected, would reduce the<br />
total returns for all years shown. Performance figures may reflect fee waivers and/or expense reimbursements. In the absence of fee waivers<br />
and/or expense reimbursements, the total return would be lower. Past performance is no guarantee of future results. Total returns may reflect<br />
adjustments to conform to generally accepted accounting principles.<br />
(b) Does not include expenses of the underlying portfolio in which the Portfolio invests.<br />
Government Income Portfolio<br />
Year Ended December 31,<br />
2008 2007 2006 2005 2004<br />
Per Share Operating Performance:<br />
Net Asset Value, beginning of year .................................... $ 11.38 $ 11.26 $ 11.40 $ 11.65 $11.92<br />
Income From Investment Operations:<br />
Net investment income .............................................. .45 .53 .54 .49 .49<br />
Net realized and unrealized gain (loss) on investments .................... .03 .10 (.13) (.20) (.13)<br />
Total from investment operations .................................. .48 .63 .41 .29 .36<br />
Less Dividends and Distributions:<br />
Dividends from net investment income ................................. — — — (.54) (.44)<br />
Distributions from net realized gains ................................... — — — — (.19)<br />
Distributions ....................................................... (.46) (.51) (.55) — —<br />
Total dividends and distributions .................................. (.46) (.51) (.55) (.54) (.63)<br />
Net Asset Value, end of year ......................................... $ 11.40 $ 11.38 $ 11.26 $ 11.40 $11.65<br />
Total Return(a) .................................................... 4.30% 5.70% 3.74% 2.51% 3.12%<br />
Ratios/Supplemental Data:<br />
Net assets, end of year (in millions) .................................... $ 370.5 $ 340.3 $ 354.3 $ 378.2 $420.2<br />
Ratios to average net assets(b):<br />
Expenses ....................................................... .52%(c) .52% .50% .47% .47%<br />
Net investment income ............................................ 3.98%(c) 4.62% 4.75% 4.16% 4.07%<br />
Portfolio turnover rate ............................................... 2707% 2377% 734% 507% 617%<br />
(a) Total return is calculated assuming a purchase of a share on the first day and a sale on the last day of each year reported and includes<br />
reinvestment of dividends and distributions and does not reflect the effect of insurance contract charges. Total return does not reflect expenses<br />
associated with the separate account such as administrative fees, account charges and surrender charges which, if reflected, would reduce the<br />
total returns for all years shown. Performance figures may reflect fee waivers and/or expense reimbursements. In the absence of fee waivers<br />
and/or expense reimbursements, the total return would be lower. Past performance is no guarantee of future results. Total returns may reflect<br />
adjustments to conform to generally accepted accounting principles.<br />
(b) Does not include expenses of the underlying portfolios in which the Portfolio invests.<br />
(c) Includes interest expense of 0.03%.<br />
73