The Prudential Series Fund
The Prudential Series Fund
The Prudential Series Fund

You also want an ePaper? Increase the reach of your titles
YUMPU automatically turns print PDFs into web optimized ePapers that Google loves.
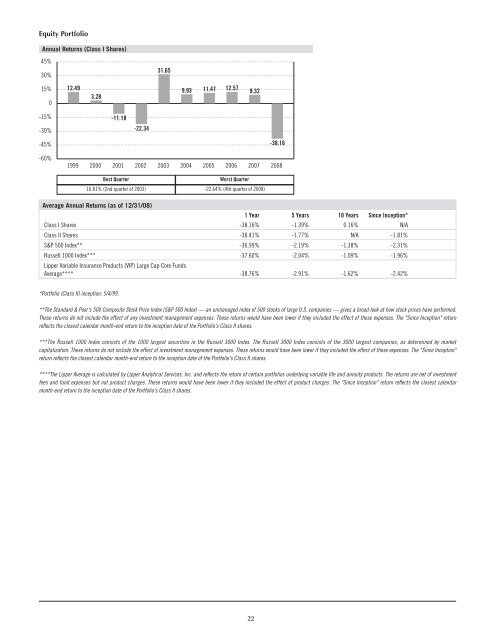
Equity Portfolio<br />
Annual Returns (Class I Shares)<br />
45%<br />
30%<br />
31.65<br />
15%<br />
0<br />
12.49<br />
3.28<br />
9.93<br />
11.47<br />
12.57<br />
9.32<br />
-15%<br />
-30%<br />
-11.18<br />
-22.34<br />
-45%<br />
-38.16<br />
-60%<br />
1999<br />
2000<br />
2001<br />
2002<br />
2003<br />
2004<br />
2005<br />
2006<br />
2007<br />
2008<br />
Best Quarter<br />
Worst Quarter<br />
16.81% (2nd quarter of 2003) -22.64% (4th quarter of 2008)<br />
Average Annual Returns (as of 12/31/08)<br />
1 Year 5 Years 10 Years Since Inception*<br />
Class I Shares -38.16% -1.39% 0.16% N/A<br />
Class II Shares -38.41% -1.77% N/A -1.81%<br />
S&P 500 Index** -36.99% -2.19% -1.38% -2.31%<br />
Russell 1000 Index*** -37.60% -2.04% -1.09% -1.96%<br />
Lipper Variable Insurance Products (VIP) Large Cap Core <strong>Fund</strong>s<br />
Average**** -38.76% -2.91% -1.62% -2.42%<br />
*Portfolio (Class II) inception: 5/4/99.<br />
**<strong>The</strong> Standard & Poor's 500 Composite Stock Price Index (S&P 500 Index) — an unmanaged index of 500 stocks of large U.S. companies — gives a broad look at how stock prices have performed.<br />
<strong>The</strong>se returns do not include the effect of any investment management expenses. <strong>The</strong>se returns would have been lower if they included the effect of these expenses. <strong>The</strong> "Since Inception" return<br />
reflects the closest calendar month-end return to the inception date of the Portfolio's Class II shares.<br />
***<strong>The</strong> Russell 1000 Index consists of the 1000 largest securities in the Russell 3000 Index. <strong>The</strong> Russell 3000 Index consists of the 3000 largest companies, as determined by market<br />
capitalization. <strong>The</strong>se returns do not include the effect of investment management expenses. <strong>The</strong>se returns would have been lower if they included the effect of these expenses. <strong>The</strong> "Since Inception"<br />
return reflects the closest calendar month-end return to the inception date of the Portfolio's Class II shares.<br />
****<strong>The</strong> Lipper Average is calculated by Lipper Analytical Services, Inc. and reflects the return of certain portfolios underlying variable life and annuity products. <strong>The</strong> returns are net of investment<br />
fees and fund expenses but not product charges. <strong>The</strong>se returns would have been lower if they included the effect of product charges. <strong>The</strong> "Since Inception" return reflects the closest calendar<br />
month-end return to the inception date of the Portfolio's Class II shares.<br />
22