Annual Report 2003 2004
Annual Report 2003 2004
Annual Report 2003 2004

You also want an ePaper? Increase the reach of your titles
YUMPU automatically turns print PDFs into web optimized ePapers that Google loves.
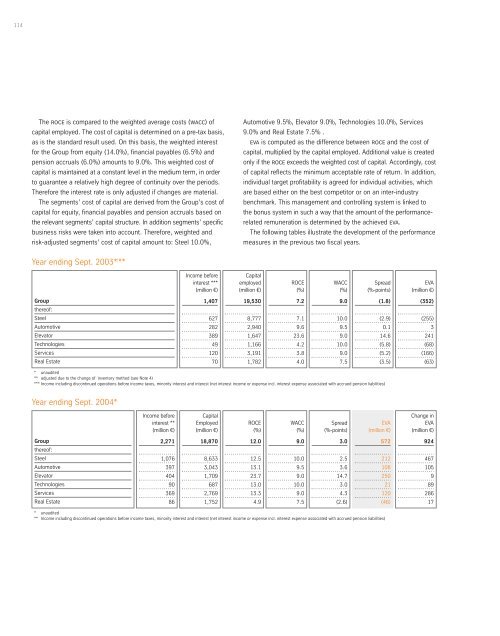
114<br />
The roce is compared to the weighted average costs (wacc) of<br />
capital employed. The cost of capital is determined on a pre-tax basis,<br />
as is the standard result used. On this basis, the weighted interest<br />
for the Group from equity (14.0%), financial payables (6.5%) and<br />
pension accruals (6.0%) amounts to 9.0%. This weighted cost of<br />
capital is maintained at a constant level in the medium term, in order<br />
to guarantee a relatively high degree of continuity over the periods.<br />
Therefore the interest rate is only adjusted if changes are material.<br />
The segments’ cost of capital are derived from the Group’s cost of<br />
capital for equity, financial payables and pension accruals based on<br />
the relevant segments’ capital structure. In addition segments’ specific<br />
business risks were taken into account. Therefore, weighted and<br />
risk-adjusted segments’ cost of capital amount to: Steel 10.0%,<br />
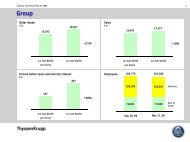
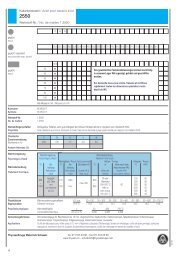
Year ending Sept. <strong>2003</strong>* I **<br />
Group<br />
thereof:<br />
Steel<br />
Automotive<br />
Elevator<br />
Technologies<br />
Services<br />
Real Estate<br />
Automotive 9.5%, Elevator 9.0%, Technologies 10.0%, Services<br />
9.0% and Real Estate 7.5% .<br />
eva is computed as the difference between roce and the cost of<br />
capital, multiplied by the capital employed. Additional value is created<br />
only if the roce exceeds the weighted cost of capital. Accordingly, cost<br />
of capital reflects the minimum acceptable rate of return. In addition,<br />
individual target profitability is agreed for individual activities, which<br />
are based either on the best competitor or on an inter-industry<br />
benchmark. This management and controlling system is linked to<br />
the bonus system in such a way that the amount of the performancerelated<br />
remuneration is determined by the achieved eva.<br />
The following tables illustrate the development of the performance<br />
measures in the previous two fiscal years.<br />
Spread<br />
(%-points)<br />
* unaudited<br />
** adjusted due to the change of inventory method (see Note 4)<br />
*** Income including discontinued operations before income taxes, minority interest and interest (net interest income or expense incl. interest expense associated with accrued pension liabilities)<br />
Year ending Sept. <strong>2004</strong>*<br />
Group<br />
thereof:<br />
Steel<br />
Automotive<br />
Elevator<br />
Technologies<br />
Services<br />
Real Estate<br />
Income before<br />
interest **<br />
(million €)<br />
2,271<br />
1,076<br />
397<br />
404<br />
90<br />
369<br />
86<br />
Income before<br />
interest ***<br />
(million €)<br />
1,407<br />
627<br />
282<br />
389<br />
49<br />
120<br />
70<br />
Capital<br />
Employed<br />
(million €)<br />
18,870<br />
8,633<br />
3,043<br />
1,709<br />
687<br />
2,769<br />
1,752<br />
Capital<br />
employed<br />
(million €)<br />
* unaudited<br />
** Income including discontinued operations before income taxes, minority interest and interest (net interest income or expense incl. interest expense associated with accrued pension liabilities)<br />
19,530<br />
8,777<br />
2,940<br />
1,647<br />
1,166<br />
3,191<br />
1,782<br />
ROCE<br />
(%)<br />
12.0<br />
12.5<br />
13.1<br />
23.7<br />
13.0<br />
13.3<br />
4.9<br />
ROCE<br />
(%)<br />
7.2<br />
7.1<br />
9.6<br />
23.6<br />
4.2<br />
3.8<br />
4.0<br />
WACC<br />
(%)<br />
9.0<br />
10.0<br />
9.5<br />
9.0<br />
10.0<br />
9.0<br />
7.5<br />
WACC<br />
(%)<br />
9.0<br />
10.0<br />
9.5<br />
9.0<br />
10.0<br />
9.0<br />
7.5<br />
Spread<br />
(%-points)<br />
3.0<br />
2.5<br />
3.6<br />
14.7<br />
3.0<br />
4.3<br />
(2.6)<br />
(1.8)<br />
(2.9)<br />
0.1<br />
14.6<br />
(5.8)<br />
(5.2)<br />
(3.5)<br />
EVA<br />
(million €)<br />
572<br />
212<br />
108<br />
250<br />
21<br />
120<br />
(46)<br />
EVA<br />
(million €)<br />
(352)<br />
(255)<br />
3<br />
241<br />
(68)<br />
(166)<br />
(63)<br />
Change in<br />
EVA<br />
(million €)<br />
924<br />
467<br />
105<br />
9<br />
89<br />
286<br />
17