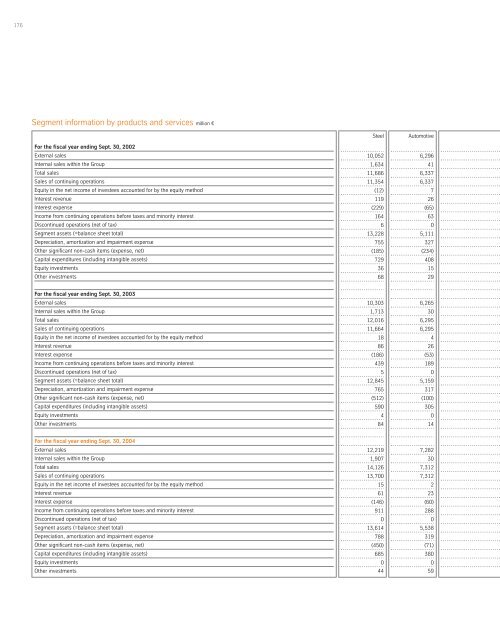
176 Segment information by products and services million € For the fiscal year ending Sept. 30, 2002 External sales Internal sales within the Group Total sales Sales of continuing operations Equity in the net income of investees accounted for by the equity method Interest revenue Interest expense Income from continuing operations before taxes and minority interest Discontinued operations (net of tax) Segment assets (=balance sheet total) Depreciation, amortization and impairment expense Other significant non-cash items (expense, net) Capital expenditures (including intangible assets) Equity investments Other investments For the fiscal year ending Sept. 30, <strong>2003</strong> External sales Internal sales within the Group Total sales Sales of continuing operations Equity in the net income of investees accounted for by the equity method Interest revenue Interest expense Income from continuing operations before taxes and minority interest Discontinued operations (net of tax) Segment assets (=balance sheet total) Depreciation, amortization and impairment expense Other significant non-cash items (expense, net) Capital expenditures (including intangible assets) Equity investments Other investments For the fiscal year ending Sept. 30, <strong>2004</strong> External sales Internal sales within the Group Total sales Sales of continuing operations Equity in the net income of investees accounted for by the equity method Interest revenue Interest expense Income from continuing operations before taxes and minority interest Discontinued operations (net of tax) Segment assets (=balance sheet total) Depreciation, amortization and impairment expense Other significant non-cash items (expense, net) Capital expenditures (including intangible assets) Equity investments Other investments Steel 10,052 1,634 11,686 11,354 (12) 119 (229) 164 6 13,228 755 (185) 729 36 68 10,303 1,713 12,016 11,664 18 86 (186) 439 5 12,845 765 (512) 590 4 84 12,219 1,907 14,126 13,700 15 61 (146) 911 0 13,614 788 (450) 685 0 44 Automotive 6,296 41 6,337 6,337 7 26 (65) 63 0 5,111 327 (234) 408 15 29 6,265 30 6,295 6,295 4 26 (53) 189 0 5,159 317 (100) 305 0 14 7,282 30 7,312 7,312 2 23 (60) 288 0 5,538 319 (71) 380 0 59
177 Financial <strong>Report</strong> Consolidated financial statements Group 36,698 0 36,698 35,928 18 123 (407) 764 (23) 31,160 1,949 (836) 1,535 57 185 36,137 0 36,137 35,327 57 119 (310) 774 (10) 30,141 1,549 (1,298) 1,282 7 315 40,056 0 40,056 39,342 20 80 (298) 1,580 20 31,141 1,516 (958) 1,431 13 290 Consolidation 0 (2,394) (2,394) (2,213) (2) (677) 677 (11) 0 (26,095) 0 3 (5) 0 (88) 0 (2,542) (2,542) (2,353) (4) (511) 511 (15) 0 (25,733) 0 (1) (6) 0 (63) 0 (2,703) (2,703) (2,582) (16) (466) 466 (19) 0 (25,991) (2) (1) (11) 0 (121) Corporate 43 2 45 45 13 469 (491) (90) 0 19,539 38 (34) 7 0 45 24 2 26 26 28 357 (380) (332) 0 19,560 21 (193) 25 0 4 26 2 28 28 0 312 (367) (380) 0 19,416 22 96 18 0 9 Real Estate 298 22 320 320 0 5 (20) 80 0 2,519 46 (7) 35 0 2 324 21 345 345 (2) 6 (12) 60 0 2,511 52 (15) 42 0 3 316 21 337 337 (2) 5 (15) 72 0 2,406 69 (6) 55 0 96 Services 10,751 647 11,398 10,779 7 44 (108) 130 (29) 6,330 295 (140) 187 6 31 10,594 656 11,250 10,603 7 33 (89) 36 (15) 5,890 185 (168) 170 0 167 11,609 687 12,296 11,887 22 45 (82) 271 20 6,188 144 (213) 131 6 10 Technologies 5,764 42 5,806 5,806 5 114 (99) 111 0 7,359 436 (179) 126 0 55 5,271 111 5,382 5,382 6 99 (52) 42 0 6,839 164 (220) 117 0 16 5,042 50 5,092 5,092 (1) 79 (48) 67 0 6,633 125 (216) 117 7 35 Elevator 3,494 6 3,500 3,500 0 23 (72) 317 0 3,169 52 (60) 48 0 43 3,356 9 3,365 3,365 0 23 (49) 355 0 3,070 45 (89) 39 3 90 3,562 6 3,568 3,568 0 21 (46) 370 0 3,337 51 (97) 56 0 158
- Page 1 and 2:
Future Technology. ThyssenKrupp Ann
- Page 3 and 4:
C/2 ThyssenKrupp in brief ThyssenKr
- Page 5:
I Letter to stockholders Your Thyss
- Page 9:
III Letter to stockholders What are
- Page 13:
03-22 To our stockholders 23-50 Bus
- Page 16 and 17:
04 0 To our stockholders In fall 20
- Page 18 and 19:
06 Executive Board and Supervisory
- Page 20 and 21:
08 Report by the Supervisory Board
- Page 22 and 23:
10 The Annual General Meeting re-el
- Page 24 and 25:
12 Dr. h.c. Friedel Neuber, member
- Page 26 and 27:
14 Executive Board compensation is
- Page 28 and 29:
16 Supervisory Board compensation i
- Page 30 and 31:
18 ThyssenKrupp stock Climbing more
- Page 32 and 33:
20 ThyssenKrupp stock is included i
- Page 34 and 35:
22 Our ir work won several awards.
- Page 36 and 37:
24 Business performance ThyssenKrup
- Page 38 and 39:
26 World crude steel production exc
- Page 40 and 41:
28 Order intake and sales improved
- Page 42 and 43:
30 Crude steel production at Thysse
- Page 44 and 45:
32 Market position in Asia signific
- Page 46 and 47:
34 Chemical and cement plant busine
- Page 48 and 49:
36 The contracts on the German ship
- Page 50 and 51:
38 The use of e-procurement reduced
- Page 52 and 53:
40 Our products and processes contr
- Page 54 and 55:
42 Steelmaking base in Duisburg mod
- Page 56 and 57:
44 All segments increased their ear
- Page 58 and 59:
46 distribution will be adjusted ac
- Page 60 and 61:
48 The boom on the steel market wil
- Page 62 and 63:
50 No supply bottlenecks are expect
- Page 64 and 65:
52 Our future potential ThyssenKrup
- Page 66 and 67:
54 The ThyssenKrupp Innovation Cont
- Page 68 and 69:
56 NewSteelBody attracting major in
- Page 70 and 71:
58 ThyssenKrupp moving walks are fa
- Page 72 and 73:
60 Zinc helps reinforced concrete l
- Page 74 and 75:
62 ThyssenKrupp supports Tongji Uni
- Page 76 and 77:
64 The best projects cover a broad
- Page 78 and 79:
66 Several university chairs are su
- Page 80 and 81:
68 More than 60,000 visitors made o
- Page 82 and 83:
70 Business areas and segments Thys
- Page 84 and 85:
72 Steel aims to defend its leading
- Page 86 and 87:
74 Automotive sees growth potential
- Page 88 and 89:
76 Exploiting cross-selling potenti
- Page 90 and 91:
78 The shipyards in Hamburg, Emden
- Page 92 and 93:
80 More than 125,000 articles avail
- Page 94 and 95:
82 Extensive improvement programs a
- Page 96 and 97:
84 How hard is it to turn TECHNOLOG
- Page 98 and 99:
86 Education Environment Knowledge
- Page 100 and 101:
88 1 Innovation. Materials Steel sh
- Page 102 and 103:
90 OFFERING PROTECTION The view thr
- Page 104 and 105:
92 PROMOTING EFFICIENCY Innovative
- Page 106 and 107:
94 2 SUSANNE SCHLEGEL, NOTHELFER In
- Page 108 and 109:
96 SIMPLIFYING PROCESSES Thanks to
- Page 110 and 111:
98 INCREASING COST EFFECTIVENESS WO
- Page 112 and 113:
100 3 Innovation. Communication Fir
- Page 114 and 115:
102 CREATING UNDERSTANDING From the
- Page 116 and 117:
104 UNLOCKING POTENTIAL Complex tec
- Page 118 and 119:
106 What idea do you have?
- Page 120 and 121:
108 Financial report Some people re
- Page 122 and 123:
110 The results of Stainless Steel
- Page 124 and 125:
112 compared to the previous year,
- Page 126 and 127:
114 The roce is compared to the wei
- Page 128 and 129:
116 The discontinued operations use
- Page 130 and 131:
118 Trade accounts payable increase
- Page 132 and 133:
120 summarized first by currency an
- Page 134 and 135:
122 The strongly export-dependent G
- Page 136 and 137:
124 In order to further lower the d
- Page 138 and 139: 126 Auditors’ Report We have audi
- Page 140 and 141: 128 ThyssenKrupp ag Consolidated Ba
- Page 142 and 143: 130 ThyssenKrupp ag Consolidated St
- Page 144 and 145: 132 Notes to the consolidated finan
- Page 146 and 147: 134 Research and development costs
- Page 148 and 149: 136 Accrued pension and similar obl
- Page 150 and 151: 138 actuarially equivalent to the b
- Page 152 and 153: 140 The final purchase price alloca
- Page 154 and 155: 142 In September 2004, the Steel se
- Page 156 and 157: 144 Due to the fact that the Group
- Page 158 and 159: 146 The following table reconciles
- Page 160 and 161: 148 NOTES TO THE CONSOLIDATED BALAN
- Page 162 and 163: 150 Consolidated Fixed Assets Sched
- Page 164 and 165: 152 11 Operating lease as lessor Th
- Page 166 and 167: 154 The contractual maturities of d
- Page 168 and 169: 156 Dividend proposal The Executive
- Page 170 and 171: 158 million € Change in projected
- Page 172 and 173: 160 in % The Group applied the foll
- Page 174 and 175: 162 in % Weighted-average assumptio
- Page 176 and 177: 164 Restructuring measures are bein
- Page 178 and 179: 166 As of September 30, 2004, Thyss
- Page 180 and 181: 168 The terms of these guarantees d
- Page 182 and 183: 170 The intention of currency hedgi
- Page 184 and 185: 172 The notional amounts of the der
- Page 186 and 187: 174 30 Segment reporting According
- Page 190 and 191: 178 Segment information by geograph
- Page 192 and 193: 180 OTHER INFORMATION 33 Earnings p
- Page 194 and 195: 182 Inventory valuation Lower of co
- Page 196 and 197: 184 Scope of consolidation Under Ar
- Page 198 and 199: 186 3. OTHER DIRECTORSHIPS HELD BY
- Page 200 and 201: 188 4. OTHER DIRECTORSHIPS HELD BY
- Page 202 and 203: 190 5. WAIVE OF DISCLOSURE PURSUANT
- Page 204 and 205: 192 ThyssenKrupp Federn GmbH Hagen
- Page 206 and 207: 194 Additional information Any info
- Page 208 and 209: 196 ThyssenKrupp Group Ecomomic val
- Page 210 and 211: 198 Company (as of September 30, 20
- Page 212 and 213: 200 Company (as of September 30, 20
- Page 214 and 215: 202 Glossary A Average collection p
- Page 216 and 217: 204 Contact/2005/2006 dates For mor
- Page 219 and 220: Ideas are soon forgotten if you don