- Page 1 and 2: Volume II THE 19 TH ANNUAL CLEMENT
- Page 3 and 4: 19 th Annual Clement S. Stacy Under
- Page 5 and 6: Rachel Kalthoff Hillsdale College A
- Page 7 and 8: his readers. He wrote: If, however,
- Page 9 and 10: omantic style also appealed to Irvi
- Page 11 and 12: Irving approached the Indians in th
- Page 13 and 14: uffaloes scouring their native prai
- Page 15 and 16: western stories mimicked his Easter
- Page 17 and 18: Irving’s conservatism went deeper
- Page 19 and 20: watching the America of the founder
- Page 21 and 22: Chittenden, Hiram M. “Astoria”
- Page 23 and 24: Alexis Klosinski Bethel College The
- Page 25 and 26: chapter is dedicated to this group
- Page 27 and 28: carefully aimed throw. Zaroff can a
- Page 29 and 30: personality disorder under the decl
- Page 31 and 32: variable, by including three additi
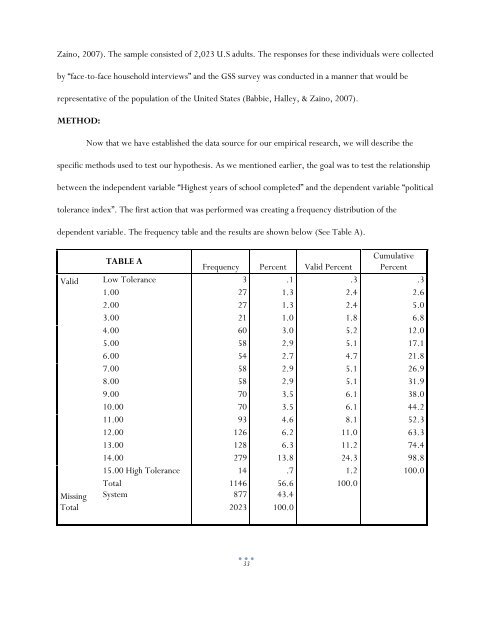
- Page 33 and 34: LITERATURE REVIEW: The relationship
- Page 35: education group, and the high- educ
- Page 39 and 40: Political Tolerance Recoded Low Tol
- Page 41 and 42: As we can see, this relationship is
- Page 43 and 44: There are also few other observatio
- Page 45 and 46: allowed to speak, or not? B. Suppos
- Page 47 and 48: this analysis, I will: 1) discuss t
- Page 49 and 50: organization that was behind the fe
- Page 51 and 52: illion in sales (“Millions”). T
- Page 53 and 54: Analysis of Secular Billboard Campa
- Page 55 and 56: Both of these character themes pres
- Page 57 and 58: organizations counters everything A
- Page 59 and 60: common enemy, Americans found a com
- Page 61 and 62: “Non Religious Billboard Brings C
- Page 63 and 64: Jordan D. Leising Saint Joseph’s
- Page 65 and 66: trafficking, FARC is known for usin
- Page 67 and 68: was first elected. But the question
- Page 69 and 70: All together for the answer Should
- Page 71 and 72: Rudin, Ken. "Ronald Reagan And The
- Page 73 and 74: adult figure, when things didn’t
- Page 75 and 76: Another thing that Hoffman uses to
- Page 77 and 78: Aryn Lietzke Carroll University Con
- Page 79 and 80: allegiance or religious state is un
- Page 81 and 82: Danielle Malloy Saint Xavier Univer
- Page 83 and 84: encourage the Anglo-Saxon people on
- Page 85 and 86: of a divine good that man should st
- Page 87 and 88:
clear in the language that he utili
- Page 89 and 90:
placement of these bead men at the
- Page 91 and 92:
meet the human demand for philosoph
- Page 93 and 94:
Troilus is woeful, but it is his ba
- Page 95 and 96:
Troilus’ mind is continuously occ
- Page 97 and 98:
fiercely and relentlessly, discusse
- Page 99 and 100:
evocation of God also proves to be
- Page 101 and 102:
the 14 th century preoccupation wit
- Page 103 and 104:
Nicole Manter Purdue University Cal
- Page 105 and 106:
Though Shakespeare’s comedy was w
- Page 107 and 108:
Why are Shakespeare and The Merchan
- Page 109 and 110:
Sharneé Maresh University of Michi
- Page 111 and 112:
excellence as a Sheriff, Sam Deeds
- Page 113 and 114:
that night. At this, Otis finally c
- Page 115 and 116:
Stephen Matteson Bethel College Fre
- Page 117 and 118:
and produces a rule, based on said
- Page 119 and 120:
While the vast majority of the boys
- Page 121 and 122:
civilization, his tendencies to gui
- Page 123 and 124:
In this pivotal scene, Jack breaks
- Page 125 and 126:
doctrine of the dominant Catholic C
- Page 127 and 128:
Christianity, mainly because most o
- Page 129 and 130:
to open a dialogue between modern a
- Page 131 and 132:
acting within God’s story and doi
- Page 133 and 134:
that if truth exists, it exists onl
- Page 135 and 136:
a “transaction” to “interacti
- Page 137 and 138:
style, Patton identifies Miller as
- Page 139 and 140:
not wrong for us to take something
- Page 141 and 142:
It is impossible to tell if decades
- Page 143 and 144:
Works Cited Bailey, Sarah Pulliam.
- Page 145 and 146:
do, it is as if Ophelia cannot leav
- Page 147 and 148:
Ophelia’s mad scene, in Act Four,
- Page 149 and 150:
Jason Melton Purdue University Calu
- Page 151 and 152:
A third possibility could be where
- Page 153 and 154:
Works Cited Kane, Robert (ed.). Fre
- Page 155 and 156:
egarding homosexuality in Judaism a
- Page 157 and 158:
Plaskow addresses the Jewish notion
- Page 159 and 160:
long-established value of the male-
- Page 161 and 162:
Muslim identity through the notion
- Page 163 and 164:
opposed to other European colonies
- Page 165 and 166:
In an article published during the
- Page 167 and 168:
the war. At seven years old, he rem
- Page 169 and 170:
The small amount of money from Fren
- Page 171 and 172:
of each nation, it’s difficult to
- Page 173 and 174:
the series is still devoured by wom
- Page 175 and 176:
from the pages of these otherworldl
- Page 177 and 178:
(26), which is to say that these gi
- Page 179 and 180:
a man‟s behavior and learn to res
- Page 181 and 182:
Edward, she also becomes bolder in
- Page 183 and 184:
Dening, Sarah. The Mythology of Sex
- Page 185 and 186:
The second book in the series that
- Page 187 and 188:
Zachary R. Murphy University of Mic
- Page 189 and 190:
Now that we understand qualia we ca
- Page 191 and 192:
It is important to realize that his
- Page 193 and 194:
Elyse Nelmark Central Michigan Univ
- Page 195 and 196:
worldviews in Western thought. The
- Page 197 and 198:
can foster destructive behavior, ev
- Page 199 and 200:
through Becker. I find it interesti
- Page 201 and 202:
the term can be used in a life-affi
- Page 203 and 204:
states the goods of life are not ab
- Page 205 and 206:
Some religious movements that are c
- Page 207 and 208:
ut words have the ability to mean b
- Page 209 and 210:
However, thinking is done in a “n
- Page 211 and 212:
understand the complexity of an act
- Page 213 and 214:
stronger grounds for believing that
- Page 215 and 216:
oom, while the child was directed i
- Page 217 and 218:
likely than not the car being discu
- Page 219 and 220:
is required, yet does not have the
- Page 221 and 222:
question: “Does Tammy have a righ
- Page 223 and 224:
“Do kids have the right to disobe
- Page 225 and 226:
thinks he will try to kidnap him or
- Page 227 and 228:
Findings of the current study sugge
- Page 229 and 230:
James Palmer Wilmington College Wha
- Page 231 and 232:
Figure 2. Burying the U.S. Constitu
- Page 233 and 234:
streets and infuriated many who up
- Page 235 and 236:
created the curfew, was issued by M
- Page 237 and 238:
would bring a machete, ice pick, or
- Page 239 and 240:
negative attitudes towards the Nati
- Page 241 and 242:
and situation, then the shooting of
- Page 243 and 244:
had broken their promise to back of
- Page 245 and 246:
There was a clear misunderstanding
- Page 247 and 248:
Allison Krause was a nineteen-year-
- Page 249 and 250:
created the Candlelight Walk and Vi
- Page 251 and 252:
Carolyn Payne Saginaw Valley State
- Page 253 and 254:
god long before he was ever on Eart
- Page 255 and 256:
have been very different, and the w
- Page 257 and 258:
like ours, associates some idea of
- Page 259 and 260:
presenting his faith in fiction, he
- Page 261 and 262:
Kristen Peters Central Michigan Uni
- Page 263 and 264:
een able to interpret and broaden t
- Page 265 and 266:
Jewish texts and traditions to incl
- Page 267 and 268:
Matthew 6:21. On the Dumbledores’
- Page 269 and 270:
The connection between Voldemort an
- Page 271 and 272:
does not explain the other conseque
- Page 273 and 274:
understand that words gracing the D
- Page 275 and 276:
Over the seven novels, Harry grows
- Page 277 and 278:
is reminiscent of “the hope of Ch
- Page 279 and 280:
Version of the Bible, the idea is t
- Page 281 and 282:
in the forest, Rowling shows that H
- Page 283 and 284:
established in the books as a gatew
- Page 285 and 286:
as Voldemort does, while “the las
- Page 287 and 288:
Angela Pusateri Saint Xavier Univer
- Page 289 and 290:
Westerns are a crucial venue for th
- Page 291 and 292:
In his discussion of The Searchers
- Page 293 and 294:
Stagecoach Stagecoach took Westerns
- Page 295 and 296:
the benches for Ringo. He is made t
- Page 297 and 298:
people of the stage have to put asi
- Page 299 and 300:
she will allow Dallas to serve her,
- Page 301 and 302:
This film was made during a period
- Page 303 and 304:
Aaron is not unaware of the feeling
- Page 305 and 306:
all of Monument Valley visible in t
- Page 307 and 308:
absent from this one. Liberty Valan
- Page 309 and 310:
There is an aura of inevitability t
- Page 311 and 312:
society. Yet, as that individual be
- Page 313 and 314:
transport grid. It is becoming incr
- Page 315 and 316:
assertive in its foreign policy (Å
- Page 317 and 318:
It is relatively clear that neither
- Page 319 and 320:
NATO-Russia Council. Additionally,
- Page 321 and 322:
attended the Russia-NATO summit, hi
- Page 323 and 324:
Works Cited Alcaro, Riccardo, and E
- Page 325 and 326:
Regan Schaeffer Central Michigan Un
- Page 327 and 328:
perpetuity. Now, we must not only f
- Page 329 and 330:
disregard for the interests of othe
- Page 331 and 332:
changed the way that Victorian wome
- Page 333 and 334:
The second main characteristic that
- Page 335 and 336:
Connubial aptitude exact, Diversity
- Page 337 and 338:
themselves to the work which it ent
- Page 339 and 340:
ehavior, Victorian patriarchal soci
- Page 341 and 342:
Marian’s masculine and feminine c
- Page 343 and 344:
Fosco tells Sir Percival that Maria
- Page 345 and 346:
shoulders, and a little straw hat o
- Page 347 and 348:
occur in the outside world, but by
- Page 349 and 350:
The Husband, the wife, and The Woma
- Page 351 and 352:
Miller, D.A. “Cage Aux Folles: Se
- Page 353 and 354:
Melville. He is clearly writing fro
- Page 355 and 356:
eing their own honorary degree, whi
- Page 357 and 358:
It all comes down to some kind of s
- Page 359 and 360:
The Kathy Bulucous Memorial Collect
- Page 361 and 362:
infamous Google search engine did l
- Page 363 and 364:
Spear Bearer (see fig. 3). The basi
- Page 365 and 366:
ut as functional objects. For examp
- Page 367 and 368:
experimental group was a comparison
- Page 369 and 370:
majority of control group answers (
- Page 371 and 372:
asked to describe the use of this o
- Page 373 and 374:
the mask through asking for a one w
- Page 375 and 376:
mask (see figure 28) that was even
- Page 377 and 378:
to be free from all those deformiti
- Page 379 and 380:
Courtland Stokes Purdue University
- Page 381 and 382:
ing the events in the dramatic narr
- Page 383 and 384:
living immorally, an example. Isabe
- Page 385 and 386:
Essentially in the Duke’s absence
- Page 387 and 388:
Jessica M. Tabor Purdue University
- Page 389 and 390:
* Sensitive. * Socially withdrawn.
- Page 391 and 392:
various media coverage and has gain
- Page 393 and 394:
Although the questionnaire of Dr. O
- Page 395 and 396:
Digital Footprint - Evidence of a p
- Page 397 and 398:
Erika Trigg University of Michigan-
- Page 399 and 400:
this moment with soft music playing
- Page 401 and 402:
locking, as she stands across the s
- Page 403 and 404:
Indian Ocean Tsunami. These tragedi
- Page 405 and 406:
This debate is much the same concer
- Page 407 and 408:
individuals of different groups wou
- Page 409 and 410:
to work as a volunteer. So if they
- Page 411 and 412:
places clear equality on all partie
- Page 413 and 414:
Al Jazeera. (2008, November 7). Cam
- Page 415 and 416:
the practice of colonization but th
- Page 417 and 418:
he returns to India, he has begun t
- Page 419 and 420:
The confusion of culture, another m
- Page 421 and 422:
Heather Workman University of Michi
- Page 423 and 424:
laughable character and continues t
- Page 425:
Works Citied A Midsummer Night’s