EFFECTS OF EXTRUSION BLOW MOLDING INTERNAL COOLING ...
EFFECTS OF EXTRUSION BLOW MOLDING INTERNAL COOLING ...
EFFECTS OF EXTRUSION BLOW MOLDING INTERNAL COOLING ...

You also want an ePaper? Increase the reach of your titles
YUMPU automatically turns print PDFs into web optimized ePapers that Google loves.
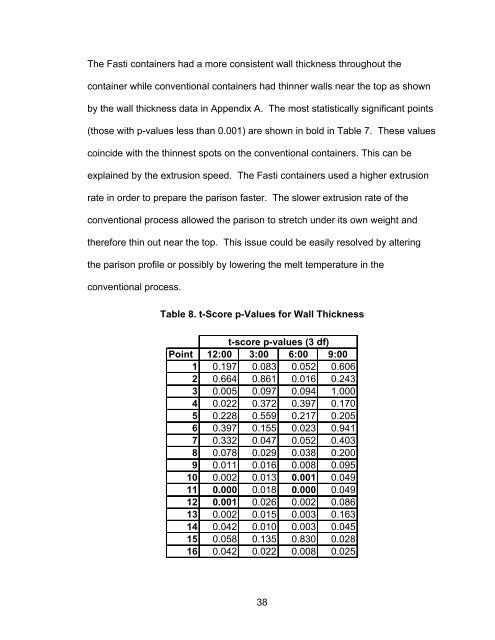
The Fasti containers had a more consistent wall thickness throughout the<br />
container while conventional containers had thinner walls near the top as shown<br />
by the wall thickness data in Appendix A. The most statistically significant points<br />
(those with p-values less than 0.001) are shown in bold in Table 7. These values<br />
coincide with the thinnest spots on the conventional containers. This can be<br />
explained by the extrusion speed. The Fasti containers used a higher extrusion<br />
rate in order to prepare the parison faster. The slower extrusion rate of the<br />
conventional process allowed the parison to stretch under its own weight and<br />
therefore thin out near the top. This issue could be easily resolved by altering<br />
the parison profile or possibly by lowering the melt temperature in the<br />
conventional process.<br />
Table 8. t-Score p-Values for Wall Thickness<br />
t-score p-values (3 df)<br />
Point 12:00 3:00 6:00 9:00<br />
1 0.197 0.083 0.052 0.606<br />
2 0.664 0.861 0.016 0.243<br />
3 0.005 0.097 0.094 1.000<br />
4 0.022 0.372 0.397 0.170<br />
5 0.228 0.559 0.217 0.205<br />
6 0.397 0.155 0.023 0.941<br />
7 0.332 0.047 0.052 0.403<br />
8 0.078 0.029 0.038 0.200<br />
9 0.011 0.016 0.008 0.095<br />
10 0.002 0.013 0.001 0.049<br />
11 0.000 0.018 0.000 0.049<br />
12 0.001 0.026 0.002 0.086<br />
13 0.002 0.015 0.003 0.163<br />
14 0.042 0.010 0.003 0.045<br />
15 0.058 0.135 0.830 0.028<br />
16 0.042 0.022 0.008 0.025<br />
38