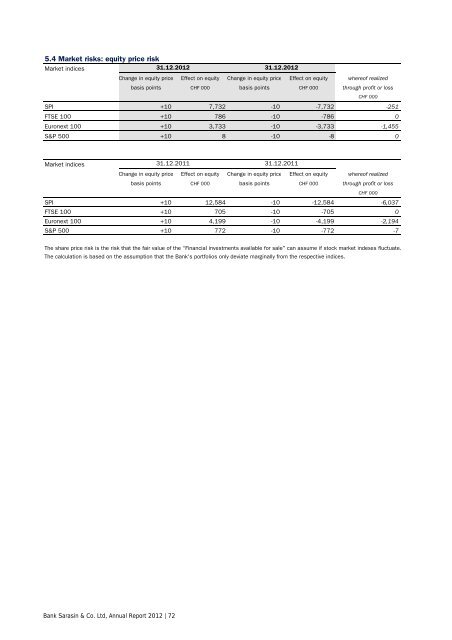
5.4 Market risks: equity price risk Market indices 31.12.<strong>2012</strong> 31.12.<strong>2012</strong> Change in equity price Effect on equity Change in equity price Effect on equity whereof realized basis points CHF 000 basis points CHF 000 through profit or loss CHF 000 SPI +10 7,732 -10 -7,732 -251 FTSE 100 +10 786 -10 -786 0 Euronext 100 +10 3,733 -10 -3,733 -1,455 S&P 500 +10 8 -10 -8 0 Market indices 31.12.2011 31.12.2011 Change in equity price Effect on equity Change in equity price Effect on equity whereof realized basis points CHF 000 basis points CHF 000 through profit or loss CHF 000 SPI +10 12,584 -10 -12,584 -6,037 FTSE 100 +10 705 -10 -705 0 Euronext 100 +10 4,199 -10 -4,199 -2,194 S&P 500 +10 772 -10 -772 -7 The share price risk is the risk that the fair value of the “Financial investments available for sale" can assume if stock market indexes fluctuate. The calculation is based on the assumption that the <strong>Bank</strong>'s portfolios only deviate marginally from the respective indices. <strong>Bank</strong> <strong>Sarasin</strong> & Co. Ltd, <strong>Annual</strong> <strong>Report</strong> <strong>2012</strong> | 72
5.5 Credit risks - classification of assets and liabilities by domestic / foreign CHF 000 31.12.<strong>2012</strong> 31.12.2011 Domestic Foreign Domestic Foreign Assets Cash and cash equivalents 1,981,223 2,308 192,598 229 Money market papers 1,453 679,065 1,797 535,261 Due from banks 417,311 2,185,724 479,496 2,092,433 Due from customers 2,829,716 5,987,969 3,055,039 6,876,997 Trading portfolio assets 307,932 321,964 292,788 400,715 Derivative financial instruments 48,882 103,174 196,146 332,519 Financial investments 268,725 2,220,243 412,513 2,197,166 Investments in associated companies 0 1,470 0 1,664 Property and equipment 100,639 8,964 109,395 6,349 Goodwill and other intangible assets 104,687 28,483 102,666 28,684 Current tax assets 7,890 594 5,946 229 Deferred tax assets 6,967 8,004 5,829 5,093 Accrued income and prepaid expenses 44,558 67,886 50,363 75,435 Other assets 26,235 9,851 19,506 18,441 Total assets 6,146,218 11,625,699 4,924,082 12,571,215 Liabilities Due to banks 733,110 590,891 1,176,897 464,110 Due to customers 7,192,511 5,935,516 6,921,785 5,697,002 Trading portfolio liabilities 80,292 0 37,603 0 Derivative financial instruments 44,374 100,654 169,902 274,851 Financial liabilities designated at fair value 785,768 253,756 829,395 0 Debt issued 444,235 0 383,927 0 Current tax liabilities 1,477 4,436 3,054 5,943 Deferred tax liabilities 13,271 1,711 5,848 1,670 Accrued expenses and deferred income 117,003 68,817 111,029 85,795 Liability to purchase minority interests 12,932 0 0 0 Other liabilities 32,655 11,445 24,976 30,123 Provisions 4,033 0 4,365 0 Total liabilities 9,461,661 6,967,226 9,668,781 6,559,494 Total shareholders' equity (incl. minority interests) 1,261,153 81,877 1,197,840 69,182 Total liabilities and shareholders' equity 10,722,814 7,049,103 10,866,621 6,628,676 <strong>Bank</strong> <strong>Sarasin</strong> & Co. Ltd, <strong>Annual</strong> <strong>Report</strong> <strong>2012</strong> | 73