7.2 Financial Instruments Fair value of financial instruments The following table shows the fair value of financial instruments based on the valuation methods and assumptions described below. Fair value is the amount for which assets could be exchanged or liabilities honoured between knowledgeable, unconnected third parties wishing to conclude a contract. The <strong>Sarasin</strong> Group uses the market price whenever an active market (e.g. a recognised stock exchange) exists because it is the best indicator of the fair value of financial instruments. CHF 000 31.12.<strong>2012</strong> Variance 31.12.2011 Variance Carrying value Fair value Carrying value Fair value Assets Cash and cash equivalents 1,983,531 1,983,531 0 192,827 192,827 0 Money market papers 680,518 680,518 0 537,058 537,058 0 Due from banks 2,603,035 2,607,169 4,134 2,571,929 2,574,531 2,602 Due from customers 8,817,685 8,894,468 76,783 9,932,036 10,028,668 96,632 Trading portfolio assets 629,896 629,896 0 693,503 693,503 0 Derivative financial instruments 152,056 152,056 0 528,665 528,665 0 Financial investments designated at fair value 354,684 354,684 0 565,813 565,813 0 Financial investments available for sale 2,134,284 2,134,284 0 2,043,866 2,043,866 0 Subtotal 17,355,689 17,436,606 80,917 17,065,697 17,164,931 99,234 Liabilities Due to banks 1,324,001 1,328,563 -4,562 1,641,007 1,647,662 -6,655 Due to customers 13,128,027 13,128,660 -633 12,618,787 12,620,451 -1,664 Trading portfolio liabilities 80,292 80,292 0 37,603 37,603 0 Derivative financial instruments 145,028 145,028 0 444,753 444,753 0 Financial liabilities designated at fair value 1,039,524 1,039,524 0 829,395 829,395 0 Debt issued 444,235 457,301 -13,066 383,927 388,127 -4,200 Subtotal 16,161,107 16,179,368 -18,261 15,955,472 15,967,991 -12,519 Total variance 62,656 86,715 The following valuation methods are used to determine the fair value of on-balance sheet financial instruments: Short-term financial instruments Financial instruments with a maturity or refinancing profile of one year or less are generally classified as short term. They may fall into any of the following balance sheet categories: “cash and other liquid assets”, “money market investments”, “money market liabilities” and, depending on the maturity, “due from banks”, “due from customers”, “due to banks” and “due to customers”. In the case of short-term financial instruments that do not have a published market value on a recognised stock exchange or a representative market (hereinafter market value), the carrying value essentially corresponds to the fair value. Long-term financial instruments These instruments, which may fall into the categories of claims on and liabilities to banks and customers, medium-term notes or loans, have a maturity or a refinancing profile of over one year. If the interest rate or the flow of payments is not determined in advance, we use replicating portfolios. Fair value is based on market rates if a liquid market exists. Otherwise it is determined by the cash value method. Trading portfolios, financial investments For the majority of financial instruments held in trading portfolios and among financial investments, fair value corresponds to market value. The fair value of instruments with no market value is determined by means of recognised valuation methods. Derivative financial instruments Fair value corresponds to market value for most positive and negative replacement values (Note 2.19). The fair value of derivative instruments with no market value is determined by means of recognised models, which take account of relevant parameters such as the contract specifications, the market price of the underlying security, the yield curve and volatility. Sensitivity of fair value compared with the use of alternative realistic valuation assumptions For a small number of financial instruments stated at fair value in the balance sheet, our valuation is derived from valuation models and not from actual market prices or other market observations. Such valuation models are continuously monitored before their introduction and during the period of their application. The adoption of less favourable assumptions would not significantly affect the fair value of the financial instruments used. <strong>Bank</strong> <strong>Sarasin</strong> & Co. Ltd, <strong>Annual</strong> <strong>Report</strong> <strong>2012</strong> | 90
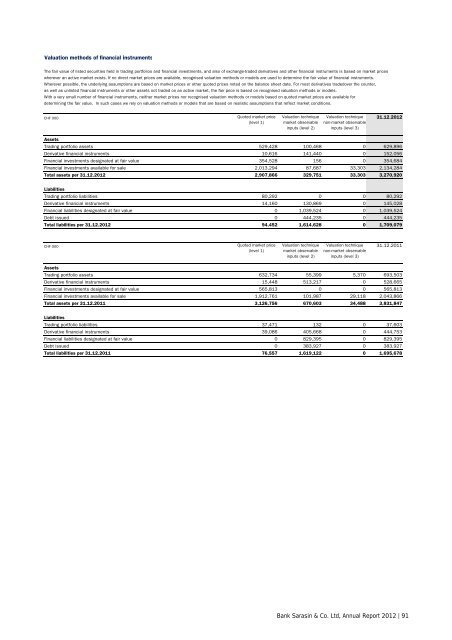
Valuation methods of financial instruments The fair value of listed securities held in trading portfolios and financial investments, and also of exchange-traded derivatives and other financial instruments is based on market prices wherever an active market exists. If no direct market prices are available, recognised valuation methods or models are used to determine the fair value of financial instruments. Wherever possible, the underlying assumptions are based on market prices or other quoted prices noted on the balance sheet date. For most derivatives tradedover the counter, as well as unlisted financial instruments or other assets not traded on an active market, the fair price is based on recognised valuation methods or models. With a very small number of financial instruments, neither market prices nor recognised valuation methods or models based on quoted market prices are available for determining the fair value. In such cases we rely on valuation methods or models that are based on realistic assumptions that reflect market conditions. CHF 000 Quoted market price Valuation technique Valuation technique 31.12.<strong>2012</strong> (level 1) market observable non-market observable inputs (level 2) inputs (level 3) Assets Trading portfolio assets 529,428 100,468 0 629,896 Derivative financial instruments 10,616 141,440 0 152,056 Financial investments designated at fair value 354,528 156 0 354,684 Financial investments available for sale 2,013,294 87,687 33,303 2,134,284 Total assets per 31.12.<strong>2012</strong> 2,907,866 329,751 33,303 3,270,920 Liabilities Trading portfolio liabilities 80,292 0 0 80,292 Derivative financial instruments 14,160 130,869 0 145,028 Financial liabilities designated at fair value 0 1,039,524 0 1,039,524 Debt issued 0 444,235 0 444,235 Total liabilities per 31.12.<strong>2012</strong> 94,452 1,614,628 0 1,709,079 CHF 000 Quoted market price Valuation technique Valuation technique 31.12.2011 (level 1) market observable non-market observable inputs (level 2) inputs (level 3) Assets Trading portfolio assets 632,734 55,399 5,370 693,503 Derivative financial instruments 15,448 513,217 0 528,665 Financial investments designated at fair value 565,813 0 0 565,813 Financial investments available for sale 1,912,761 101,987 29,118 2,043,866 Total assets per 31.12.2011 3,126,756 670,603 34,488 3,831,847 Liabilities Trading portfolio liabilities 37,471 132 0 37,603 Derivative financial instruments 39,086 405,668 0 444,753 Financial liabilities designated at fair value 0 829,395 0 829,395 Debt issued 0 383,927 0 383,927 Total liabilities per 31.12.2011 76,557 1,619,122 0 1,695,678 <strong>Bank</strong> <strong>Sarasin</strong> & Co. Ltd, <strong>Annual</strong> <strong>Report</strong> <strong>2012</strong> | 91