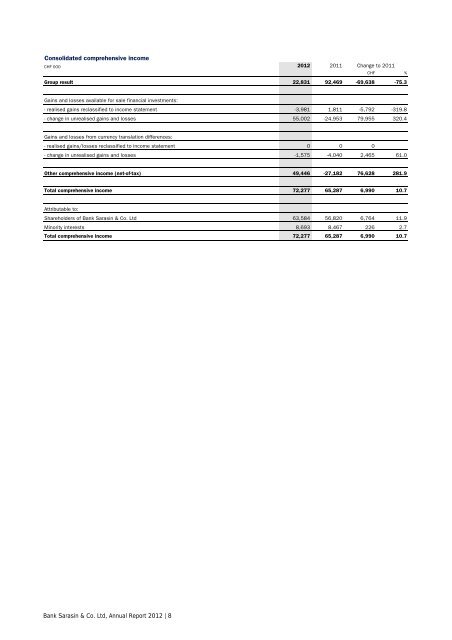
Consolidated comprehensive income CHF 000 <strong>2012</strong> 2011 Change to 2011 CHF % Group result 22,831 92,469 -69,638 -75.3 Gains and losses available for sale financial investments: - realised gains reclassified to income statement -3,981 1,811 -5,792 -319.8 - change in unrealised gains and losses 55,002 -24,953 79,955 320.4 Gains and losses from currency translation differences: - realised gains/losses reclassified to income statement 0 0 0 - change in unrealised gains and losses -1,575 -4,040 2,465 61.0 Other comprehensive income (net-of-tax) 49,446 -27,182 76,628 281.9 Total comprehensive income 72,277 65,287 6,990 10.7 Attributable to: Shareholders of <strong>Bank</strong> <strong>Sarasin</strong> & Co. Ltd 63,584 56,820 6,764 11.9 Minority interests 8,693 8,467 226 2.7 Total comprehensive income 72,277 65,287 6,990 10.7 <strong>Bank</strong> <strong>Sarasin</strong> & Co. Ltd, <strong>Annual</strong> <strong>Report</strong> <strong>2012</strong> | 8
Consolidated balance sheet Assets CHF 000 31.12.<strong>2012</strong> 31.12.2011 Change to 31.12.2011 Note in CHF in % Cash and cash equivalents 2.13 1,983,531 192,827 1,790,704 928.7 Money market papers 2.14 680,518 537,058 143,460 26.7 Due from banks 2.15 2,603,035 2,571,929 31,106 1.2 Due from customers 2.15 8,817,685 9,932,036 -1,114,351 -11.2 Trading portfolio assets 2.17 629,896 693,503 -63,607 -9.2 Derivative financial instruments 2.19 152,056 528,665 -376,609 -71.2 Financial investments 2.20 2,488,968 2,609,679 -120,711 -4.6 Investments in associated companies 2.21 1,470 1,664 -194 -11.7 Property and equipment 2.22 109,603 115,744 -6,141 -5.3 Goodwill and other intangible assets 2.23 133,170 131,350 1,820 1.4 Current tax assets 8,484 6,175 2,309 37.4 Deferred tax assets 2.10 14,971 10,922 4,049 37.1 Accrued income and prepaid expenses 112,444 125,798 -13,354 -10.6 Other assets 2.24 36,086 37,947 -1,861 -4.9 Total assets 17,771,917 17,495,297 276,620 1.6 Total subordinated assets 5,877 8,697 -2,820 -32.4 Total due from significant shareholders 152 75,987 -75,835 -99.8 Liabilities and equity CHF 000 31.12.<strong>2012</strong> 31.12.2011 Change to 31.12.2011 Note CHF % Due to banks 1,324,001 1,641,007 -317,006 -19.3 Due to customers 2.27 13,128,027 12,618,787 509,240 4.0 Trading portfolio liabilities 2.18 80,292 37,603 42,689 113.5 Derivative financial instruments 2.19 145,028 444,753 -299,725 -67.4 Financial liabilities designated at fair value 2.28 1,039,524 829,395 210,129 25.3 Debt issued 2.29 444,235 383,927 60,308 15.7 Current tax liabilities 5,913 8,997 -3,084 -34.3 Deferred tax liabilities 2.10 14,982 7,518 7,464 99.3 Accrued expenses and deferred income 185,820 196,824 -11,004 -5.6 Liability to purchase minority interests 12,932 0 12,932 Other liabilities 2.30 44,100 55,099 -10,999 -20.0 Provisions 2.31 4,033 4,365 -332 -7.6 Total liabilities 16,428,887 16,228,275 200,612 1.2 Share capital 2.32 22,015 22,015 0 0.0 Less treasury shares 2.32 0 -22,958 22,958 100.0 Capital reserve 629,534 634,011 -4,477 -0.7 Retained earnings 772,209 701,588 70,621 10.1 Reserves IAS 39 (net of tax) 5,155 -45,866 51,021 111.2 Currency translation differences -145,012 -143,081 -1,931 -1.3 Group result (excluding minority interests) 14,494 83,864 -69,370 -82.7 Shareholders' equity of shareholders of <strong>Bank</strong> <strong>Sarasin</strong> & Co. Ltd 1,298,395 1,229,573 68,822 5.6 Minority interests in shareholders' equity (including share in profit 44,635 37,449 7,186 19.2 Total shareholders' equity (including minority interests) 1,343,030 1,267,022 76,008 6.0 Total liabilities and shareholders' equity 17,771,917 17,495,297 276,620 1.6 Total subordinated liabilities 3,100 0 3,100 Total due to significant shareholders 5,820 81,715 -75,895 -92.9 <strong>Bank</strong> <strong>Sarasin</strong> & Co. Ltd, <strong>Annual</strong> <strong>Report</strong> <strong>2012</strong> | 9