Technical Development of Waste Sector in Sweden: Survey
Technical Development of Waste Sector in Sweden: Survey
Technical Development of Waste Sector in Sweden: Survey

You also want an ePaper? Increase the reach of your titles
YUMPU automatically turns print PDFs into web optimized ePapers that Google loves.
MASTER’S THESIS IN ENVIRONMENTAL STRATEGIES RESEARCH<br />
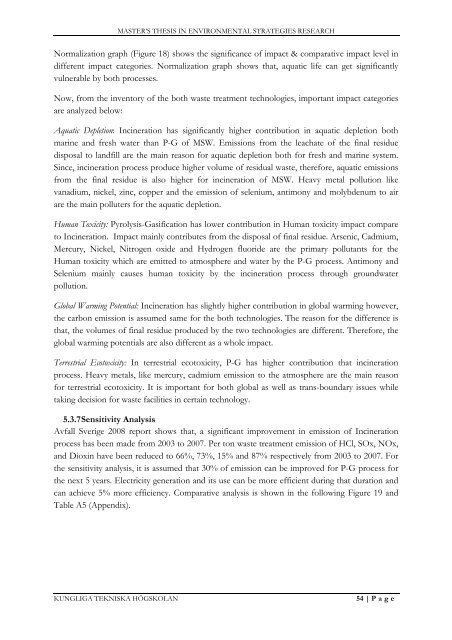
Normalization graph (Figure 18) shows the significance <strong>of</strong> impact & comparative impact level <strong>in</strong><br />
different impact categories. Normalization graph shows that, aquatic life can get significantly<br />
vulnerable by both processes.<br />
Now, from the <strong>in</strong>ventory <strong>of</strong> the both waste treatment technologies, important impact categories<br />
are analyzed below:<br />
Aquatic Depletion: Inc<strong>in</strong>eration has significantly higher contribution <strong>in</strong> aquatic depletion both<br />
mar<strong>in</strong>e and fresh water than P-G <strong>of</strong> MSW. Emissions from the leachate <strong>of</strong> the f<strong>in</strong>al residue<br />
disposal to landfill are the ma<strong>in</strong> reason for aquatic depletion both for fresh and mar<strong>in</strong>e system.<br />
S<strong>in</strong>ce, <strong>in</strong>c<strong>in</strong>eration process produce higher volume <strong>of</strong> residual waste, therefore, aquatic emissions<br />
from the f<strong>in</strong>al residue is also higher for <strong>in</strong>c<strong>in</strong>eration <strong>of</strong> MSW. Heavy metal pollution like<br />
vanadium, nickel, z<strong>in</strong>c, copper and the emission <strong>of</strong> selenium, antimony and molybdenum to air<br />
are the ma<strong>in</strong> polluters for the aquatic depletion.<br />
Human Toxicity: Pyrolysis-Gasification has lower contribution <strong>in</strong> Human toxicity impact compare<br />
to Inc<strong>in</strong>eration. Impact ma<strong>in</strong>ly contributes from the disposal <strong>of</strong> f<strong>in</strong>al residue. Arsenic, Cadmium,<br />
Mercury, Nickel, Nitrogen oxide and Hydrogen fluoride are the primary pollutants for the<br />
Human toxicity which are emitted to atmosphere and water by the P-G process. Antimony and<br />
Selenium ma<strong>in</strong>ly causes human toxicity by the <strong>in</strong>c<strong>in</strong>eration process through groundwater<br />
pollution.<br />
Global Warm<strong>in</strong>g Potential: Inc<strong>in</strong>eration has slightly higher contribution <strong>in</strong> global warm<strong>in</strong>g however,<br />
the carbon emission is assumed same for the both technologies. The reason for the difference is<br />
that, the volumes <strong>of</strong> f<strong>in</strong>al residue produced by the two technologies are different. Therefore, the<br />
global warm<strong>in</strong>g potentials are also different as a whole impact.<br />
Terrestrial Ecotoxicity: In terrestrial ecotoxicity, P-G has higher contribution that <strong>in</strong>c<strong>in</strong>eration<br />
process. Heavy metals, like mercury, cadmium emission to the atmosphere are the ma<strong>in</strong> reason<br />
for terrestrial ecotoxicity. It is important for both global as well as trans-boundary issues while<br />
tak<strong>in</strong>g decision for waste facilities <strong>in</strong> certa<strong>in</strong> technology.<br />
5.3.7 Sensitivity Analysis<br />
Avfall Sverige 2008 report shows that, a significant improvement <strong>in</strong> emission <strong>of</strong> Inc<strong>in</strong>eration<br />
process has been made from 2003 to 2007. Per ton waste treatment emission <strong>of</strong> HCl, SOx, NOx,<br />
and Diox<strong>in</strong> have been reduced to 66%, 73%, 15% and 87% respectively from 2003 to 2007. For<br />
the sensitivity analysis, it is assumed that 30% <strong>of</strong> emission can be improved for P-G process for<br />
the next 5 years. Electricity generation and its use can be more efficient dur<strong>in</strong>g that duration and<br />
can achieve 5% more efficiency. Comparative analysis is shown <strong>in</strong> the follow<strong>in</strong>g Figure 19 and<br />
Table A5 (Appendix).<br />
KUNGLIGA TEKNISKA HÖGSKOLAN<br />
54 | P a g e