SPORE Mission Design - Georgia Tech SSDL - Georgia Institute of ...
SPORE Mission Design - Georgia Tech SSDL - Georgia Institute of ...
SPORE Mission Design - Georgia Tech SSDL - Georgia Institute of ...

Create successful ePaper yourself
Turn your PDF publications into a flip-book with our unique Google optimized e-Paper software.
latitude (deg)<br />
latitude (deg)<br />
deployment altitude <strong>of</strong> Stardust and the 10 km main deployment altitude <strong>of</strong> Hayabusa. At this altitude,<br />
the entry vehicle is traveling at a low subsonic speed at a near 90° flight path angle.<br />
In the parachute portion <strong>of</strong> the trajectory, an instantaneous inflation was modeled to save time during<br />
runs. For nominal simulations, a linear inflation pr<strong>of</strong>ile with time delay for line stretch was chosen for<br />
more accurate modeling. Other than the increased drag modeled by the parachute, the equations <strong>of</strong><br />
motions also included a contribution from winds. By trimming the parachute-vehicle system to the<br />
relative wind vector, the wind contributions to the entry vehicle landing dispersions were modeled.<br />
Logic is also present in the code to check for the maximum dynamic pressure parachute constraints.<br />
For the Monte Carlo simulations, 250 runs <strong>of</strong> the trajectory were performed to capture a large enough<br />
population and keep the run time short to allow for analysis with other tools. During a collaborative<br />
design session, entry vehicle design changes and entry state tweaks resulted in all four cases meeting all<br />
constraints. The nominal values settled upon during this session are given in Table 15.<br />
Table 15: 3 DOF Monte Carlo summary<br />
1U LEO 1U GTO 2x2U LEO 2x2U GTO<br />
Nominal Entry Velocity (m/s) 7780 9964.4 7780.5 9964.3<br />
Nominal Entry Flight Path Angle (°) -5 -6.71 -5 -6.23<br />
Worst Case Heat Flux (W/cm2) 267.2 514.8 279.6 487.3<br />
Worst Case Integrated Heat Load (J/cm2) 12857 22227 13680 26175<br />
Maximum G’s 15.65 20.33 15.98 15.55<br />
Landing Ellipse Downrange (km) 58.5 37.4 53.5 51.48<br />
Landing Ellipse Crossrange (km) 33.5 4.9 31.5 4.51<br />
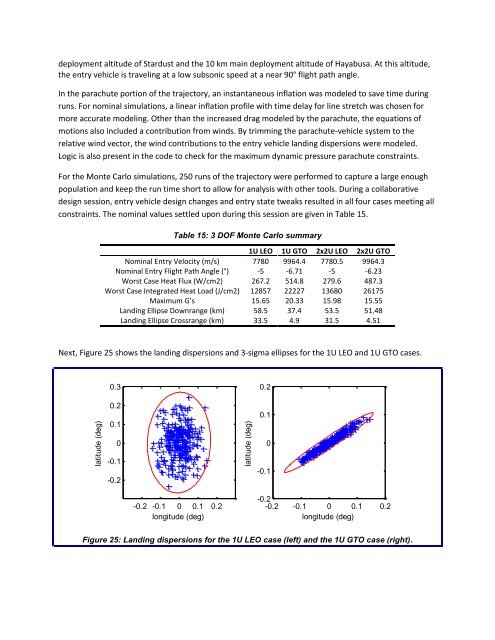
Next, Figure 25 shows the landing dispersions and 3-sigma ellipses for the 1U LEO and 1U GTO cases.<br />
0.3<br />
0.2<br />
0.1<br />
0.2<br />
0.1<br />
0<br />
-0.1<br />
-0.2<br />
0<br />
-0.1<br />
-0.2 -0.1 0 0.1 0.2<br />
longitude (deg)<br />
-0.2<br />
-0.2 -0.1 0 0.1 0.2<br />
longitude (deg)<br />
Figure 25: Landing dispersions for the 1U LEO case (left) and the 1U GTO case (right).