Analysis and Testing of Ajax-based Single-page Web Applications
Analysis and Testing of Ajax-based Single-page Web Applications
Analysis and Testing of Ajax-based Single-page Web Applications
You also want an ePaper? Increase the reach of your titles
YUMPU automatically turns print PDFs into web optimized ePapers that Google loves.
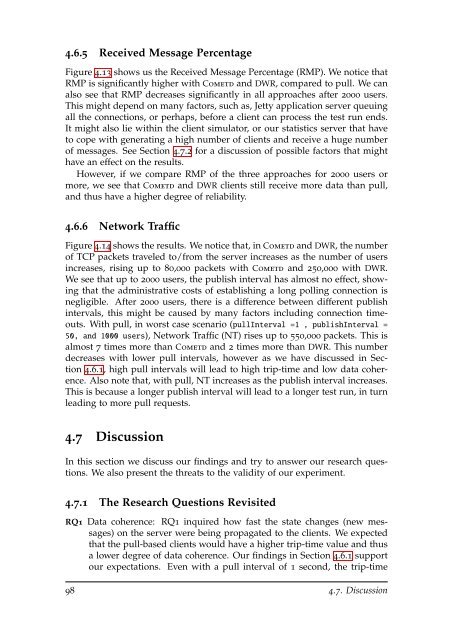
4.6.5 Received Message Percentage<br />
Figure 4.13 shows us the Received Message Percentage (RMP). We notice that<br />
RMP is significantly higher with Cometd <strong>and</strong> DWR, compared to pull. We can<br />
also see that RMP decreases significantly in all approaches after 2000 users.<br />
This might depend on many factors, such as, Jetty application server queuing<br />
all the connections, or perhaps, before a client can process the test run ends.<br />
It might also lie within the client simulator, or our statistics server that have<br />
to cope with generating a high number <strong>of</strong> clients <strong>and</strong> receive a huge number<br />
<strong>of</strong> messages. See Section 4.7.2 for a discussion <strong>of</strong> possible factors that might<br />
have an effect on the results.<br />
However, if we compare RMP <strong>of</strong> the three approaches for 2000 users or<br />
more, we see that Cometd <strong>and</strong> DWR clients still receive more data than pull,<br />
<strong>and</strong> thus have a higher degree <strong>of</strong> reliability.<br />
4.6.6 Network Traffic<br />
Figure 4.14 shows the results. We notice that, in Cometd <strong>and</strong> DWR, the number<br />
<strong>of</strong> TCP packets traveled to/from the server increases as the number <strong>of</strong> users<br />
increases, rising up to 80,000 packets with Cometd <strong>and</strong> 250,000 with DWR.<br />
We see that up to 2000 users, the publish interval has almost no effect, showing<br />
that the administrative costs <strong>of</strong> establishing a long polling connection is<br />
negligible. After 2000 users, there is a difference between different publish<br />
intervals, this might be caused by many factors including connection timeouts.<br />
With pull, in worst case scenario (pullInterval =1 , publishInterval =<br />
50, <strong>and</strong> 1000 users), Network Traffic (NT) rises up to 550,000 packets. This is<br />
almost 7 times more than Cometd <strong>and</strong> 2 times more than DWR. This number<br />
decreases with lower pull intervals, however as we have discussed in Section<br />
4.6.1, high pull intervals will lead to high trip-time <strong>and</strong> low data coherence.<br />
Also note that, with pull, NT increases as the publish interval increases.<br />
This is because a longer publish interval will lead to a longer test run, in turn<br />
leading to more pull requests.<br />
4.7 Discussion<br />
In this section we discuss our findings <strong>and</strong> try to answer our research questions.<br />
We also present the threats to the validity <strong>of</strong> our experiment.<br />
4.7.1 The Research Questions Revisited<br />
RQ1 Data coherence: RQ1 inquired how fast the state changes (new messages)<br />
on the server were being propagated to the clients. We expected<br />
that the pull-<strong>based</strong> clients would have a higher trip-time value <strong>and</strong> thus<br />
a lower degree <strong>of</strong> data coherence. Our findings in Section 4.6.1 support<br />
our expectations. Even with a pull interval <strong>of</strong> 1 second, the trip-time<br />
98 4.7. Discussion


