2005 Annual Report - Touax
2005 Annual Report - Touax
2005 Annual Report - Touax

You also want an ePaper? Increase the reach of your titles
YUMPU automatically turns print PDFs into web optimized ePapers that Google loves.
Additional information<br />
Subscribed capital<br />
The capital is fully subscribed and paid up.<br />
Shares not representing capital<br />
There are no shares which do not represent capital.<br />
Composition of the capital<br />
As at 31 December the capital comprises 3,764,919<br />
shares which have a par value of €8 and are fully<br />
paid up. Following a reserved capital increase adopted<br />
at the <strong>Annual</strong> General Meeting of 31 January<br />
2006, the capital as at the date of compilation of this<br />
document comprises 3,885,519 shares which have a<br />
par value of €8 and are fully paid up, representing<br />
5,128,031 voting rights.<br />
Potential capital<br />
The share subscription or purchase options and<br />
equity warrants granted by TOUAX SCA are detailed<br />
in the notes to the consolidated financial statements<br />
note 21 Page 80.<br />
Stock market data<br />
The TOUAX share price<br />
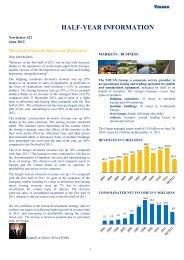
The TOUAX share ended <strong>2005</strong> at €23.45, a rise of<br />
13.83% compared to the price on 31 December 2004<br />
(€20.60). The highest level of the year was reached<br />
on 22 March <strong>2005</strong> at €23.72, the lowest level on 18<br />
April <strong>2005</strong> at €19.25.<br />
As at 31 December <strong>2005</strong>, the market capitalization of<br />
the Group amounted to €88.29 million.<br />
(€) 2001 2002 2003 2004 <strong>2005</strong><br />
Consolidated data<br />
Total number of shares as at 31 December (2) 2,838,127 2,838,127 2,838,127 2,838,127 3,764,929<br />
Net dividend per share 0.36 0.60 0.25 0.60 0.70<br />
Tax credit (1) 0.18 0.30 0.125 0.00 0.00<br />
Total dividend per share 0.54 0.90 0.375 0.60 0.70<br />
Repayment of contribution /<br />
Exceptional distribution per share 0.24 – 0.35 – –<br />
Total per share 0.78 0.90 0.725 0.60 0.7 (2)<br />
Total distributed in respect of the financial year 1,702,876 1,702,876 1,702,876 1,702,876 2,635,443<br />
Increase in distribution 5 % 0 % 0 % 0 % 55 %<br />
Share ratios<br />
Net earnings per share 1.03 0.89 0.91 1.12 1.4<br />
P.E.R. (4) 17.53 13.85 16.43 18.39 16.75<br />
Total return on share (%) 4.32 7.30 4.85 2.91 3.00 (3)<br />
Share data<br />
annual report <strong>2005</strong><br />
Historical background<br />
The TOUAX share was listed on the “Marché comptant”<br />
in Paris on 7 May 1906. It was transferred to the<br />
Second Marché on 14 June 1999. On 2 January 2002,<br />
TOUAX became part of the NextPrime segment of<br />
the Euronext market. Since that date, the TOUAX<br />
share has formed part of the sample making up the<br />
NextPrime index. Following a restructuring of the<br />
listing, TOUAX has formed part of compartment C of<br />
Eurolist Paris.<br />
Maximum price of the share 27.44 19.50 16.75 21.20 23.72<br />
Minimum price of the share 14.80 11.00 9.80 14.55 19.25<br />
Price on 31 December 18.06 12.33 14.95 20.60 23.45<br />
Market capitalisation (M€ ) on 31 December 51.26 34.99 42.43 58.47 88.29<br />
Average daily trading volume (€ thousands) 13.69 5.84 9.98 18.93 94.04<br />
Average daily number of shares traded 639 364 764 1,038 4,385<br />
(1) The tax credit is equal to 50% of the net dividend for individual shareholders resident in France.<br />
(2) The figures for the <strong>2005</strong> distribution have been drawn up on the basis of the proposal of the Managers to the General Meeting.<br />
(3) The total return on the share for <strong>2005</strong> is calculated on the basis of the price on 31 December <strong>2005</strong>.<br />
(4) Ratio of market capitalization to net income (Price Earnings Ratio).<br />
114