2005 Annual Report - Touax
2005 Annual Report - Touax
2005 Annual Report - Touax

Create successful ePaper yourself
Turn your PDF publications into a flip-book with our unique Google optimized e-Paper software.
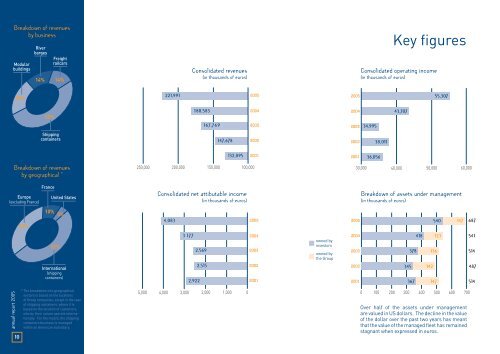
Breakdown of revenues<br />
by business<br />
Modular<br />
buildings<br />
River<br />
barges<br />
14%<br />
Freight<br />
railcars<br />
14%<br />
Consolidated revenues<br />
(in thousands of euros)<br />
Key figures<br />
Consolidated operating income<br />
(in thousands of euros)<br />
20%<br />
221,991<br />
<strong>2005</strong><br />
<strong>2005</strong><br />
55,307<br />
52%<br />
180,583<br />
2004<br />
2004<br />
43,707<br />
167,769<br />
2003<br />
2003<br />
34,995<br />
Shipping<br />
containers<br />
147,678<br />
2002<br />
2002<br />
38,011<br />
132,895<br />
2001<br />
2001<br />
36,056<br />
Breakdown of revenues<br />
by geographical *<br />
250,000 200,000<br />
150,000<br />
100,000<br />
30,000 40,000<br />
50,000 60,000<br />
Europe<br />
(excluding France)<br />
France<br />
United States<br />
Consolidated net attibutable income<br />
(in thousands of euros)<br />
Breakdown of assets under management<br />
(in thousands of euros)<br />
33%<br />
10%<br />
5%<br />
4,083<br />
<strong>2005</strong><br />
<strong>2005</strong> 540<br />
147<br />
687<br />
52%<br />
International<br />
(shipping<br />
containers)<br />
3 177<br />
2,569<br />
2,515<br />
2,922<br />
2004<br />
2003<br />
2002<br />
2001<br />
owned by<br />
investors<br />
owned by<br />
the Group<br />
2004<br />
2003<br />
2002<br />
2001<br />
418<br />
378<br />
345<br />
367<br />
123<br />
136<br />
142<br />
147<br />
541<br />
514<br />
487<br />
514<br />
annual report <strong>2005</strong><br />
10<br />
* The breakdown into geographical<br />
sectors is based on the locations<br />
of Group companies, except in the case<br />
of shipping containers, where it is<br />
based on the location of customers,<br />
who by their nature operate internationally.<br />
For the record, the shipping<br />
containers business is managed<br />
within an American subsidiary.<br />
5,000 4,000 3,000 2,000<br />
1,000<br />
0<br />
0 100 200 300 400 500 600 700<br />
Over half of the assets under management<br />
are valued in US dollars. The decline in the value<br />
of the dollar over the past two years has meant<br />
that the value of the managed fleet has remained<br />
stagnant when expressed in euros.